Mexican American Indian vs Syrian Householder Income Under 25 years

COMPARE

Mexican American Indian
Race
Ancestry
AfghanAfricanAlaska NativeAlaskan AthabascanAlbanianAleutAlsatianAmericanApacheArabArapahoArgentineanArmenianAssyrian/Chaldean/SyriacAustralianAustrianBahamianBangladeshiBarbadianBasqueBelgianBelizeanBermudanBhutaneseBlackfeetBolivianBrazilianBritishBritish West IndianBulgarianBurmeseCajunCambodianCanadianCape VerdeanCarpatho RusynCelticCentral AmericanCentral American IndianCherokeeCheyenneChickasawChileanChineseChippewaChoctawColombianColvilleComancheCosta RicanCreeCreekCroatianCrowCubanCypriotCzechCzechoslovakianDanishDelawareDominicanDutchDutch West IndianEastern EuropeanEcuadorianEgyptianEnglishEstonianEthiopianEuropeanFijianFilipinoFinnishFrenchFrench American IndianFrench CanadianGermanGerman RussianGhanaianGreekGuamanian/ChamorroGuatemalanGuyaneseHaitianHmongHonduranHopiHoumaHungarianIcelanderIndian (Asian)IndonesianInupiatIranianIraqiIrishIroquoisIsraeliItalianJamaicanJapaneseJordanianKenyanKiowaKoreanLaotianLatvianLebaneseLiberianLithuanianLumbeeLuxembourgerMacedonianMalaysianMalteseMarshalleseMenomineeMexicanMexican American IndianMongolianMoroccanNative HawaiianNavajoNepaleseNew ZealanderNicaraguanNigerianNorthern EuropeanNorwegianOkinawanOsageOttawaPaiutePakistaniPalestinianPanamanianParaguayanPennsylvania GermanPeruvianPimaPolishPortuguesePotawatomiPuebloPuerto RicanPuget Sound SalishRomanianRussianSalvadoranSamoanScandinavianScotch-IrishScottishSeminoleSenegaleseSerbianShoshoneSierra LeoneanSiouxSlavicSlovakSloveneSomaliSouth AfricanSouth AmericanSouth American IndianSoviet UnionSpaniardSpanishSpanish AmericanSpanish American IndianSri LankanSubsaharan AfricanSudaneseSwedishSwissTaiwaneseThaiTlingit-HaidaTohono O'OdhamTonganTrinidadian and TobagonianTsimshianTurkishU.S. Virgin IslanderUgandanUkrainianUruguayanUteVenezuelanVietnameseWelshWest IndianYakamaYaquiYugoslavianYumanYup'ikZimbabwean
Immigration
NonimmigrantsImmigrantsAfghanistanAfricaAlbaniaArgentinaArmeniaAsiaAustraliaAustriaBahamasBangladeshBarbadosBelarusBelgiumBelizeBoliviaBosnia and HerzegovinaBrazilBulgariaBurma/MyanmarCabo VerdeCambodiaCameroonCanadaCaribbeanCentral AmericaChileChinaColombiaCongoCosta RicaCroatiaCubaCzechoslovakiaDenmarkDominicaDominican RepublicEastern AfricaEastern AsiaEastern EuropeEcuadorEgyptEl SalvadorEnglandEritreaEthiopiaEuropeFijiFranceGermanyGhanaGreeceGrenadaGuatemalaGuyanaHaitiHondurasHong KongHungaryIndiaIndonesiaIranIraqIrelandIsraelItalyJamaicaJapanJordanKazakhstanKenyaKoreaKuwaitLaosLatin AmericaLatviaLebanonLiberiaLithuaniaMalaysiaMexicoMicronesiaMiddle AfricaMoldovaMoroccoNepalNetherlandsNicaraguaNigeriaNorth AmericaNorth MacedoniaNorthern AfricaNorthern EuropeNorwayOceaniaPakistanPanamaPeruPhilippinesPolandPortugalRomaniaRussiaSaudi ArabiaScotlandSenegalSerbiaSierra LeoneSingaporeSomaliaSouth AfricaSouth AmericaSouth Central AsiaSouth Eastern AsiaSouthern EuropeSpainSri LankaSt. Vincent and the GrenadinesSudanSwedenSwitzerlandSyriaTaiwanThailandTrinidad and TobagoTurkeyUgandaUkraineUruguayUzbekistanVenezuelaVietnamWest IndiesWestern AfricaWestern AsiaWestern EuropeYemenZaireZimbabweAzores
Syrian
Race
Ancestry
AfghanAfricanAlaska NativeAlaskan AthabascanAlbanianAleutAlsatianAmericanApacheArabArapahoArgentineanArmenianAssyrian/Chaldean/SyriacAustralianAustrianBahamianBangladeshiBarbadianBasqueBelgianBelizeanBermudanBhutaneseBlackfeetBolivianBrazilianBritishBritish West IndianBulgarianBurmeseCajunCambodianCanadianCape VerdeanCarpatho RusynCelticCentral AmericanCentral American IndianCherokeeCheyenneChickasawChileanChineseChippewaChoctawColombianColvilleComancheCosta RicanCreeCreekCroatianCrowCubanCypriotCzechCzechoslovakianDanishDelawareDominicanDutchDutch West IndianEastern EuropeanEcuadorianEgyptianEnglishEstonianEthiopianEuropeanFijianFilipinoFinnishFrenchFrench American IndianFrench CanadianGermanGerman RussianGhanaianGreekGuamanian/ChamorroGuatemalanGuyaneseHaitianHmongHonduranHopiHoumaHungarianIcelanderIndian (Asian)IndonesianInupiatIranianIraqiIrishIroquoisIsraeliItalianJamaicanJapaneseJordanianKenyanKiowaKoreanLaotianLatvianLebaneseLiberianLithuanianLumbeeLuxembourgerMacedonianMalaysianMalteseMarshalleseMenomineeMexicanMongolianMoroccanNative HawaiianNavajoNepaleseNew ZealanderNicaraguanNigerianNorthern EuropeanNorwegianOkinawanOsageOttawaPaiutePakistaniPalestinianPanamanianParaguayanPennsylvania GermanPeruvianPimaPolishPortuguesePotawatomiPuebloPuerto RicanPuget Sound SalishRomanianRussianSalvadoranSamoanScandinavianScotch-IrishScottishSeminoleSenegaleseSerbianShoshoneSierra LeoneanSiouxSlavicSlovakSloveneSomaliSouth AfricanSouth AmericanSouth American IndianSoviet UnionSpaniardSpanishSpanish AmericanSpanish American IndianSri LankanSubsaharan AfricanSudaneseSwedishSwissSyrianTaiwaneseThaiTlingit-HaidaTohono O'OdhamTonganTrinidadian and TobagonianTsimshianTurkishU.S. Virgin IslanderUgandanUkrainianUruguayanUteVenezuelanVietnameseWelshWest IndianYakamaYaquiYugoslavianYumanYup'ikZimbabwean
Immigration
NonimmigrantsImmigrantsAfghanistanAfricaAlbaniaArgentinaArmeniaAsiaAustraliaAustriaBahamasBangladeshBarbadosBelarusBelgiumBelizeBoliviaBosnia and HerzegovinaBrazilBulgariaBurma/MyanmarCabo VerdeCambodiaCameroonCanadaCaribbeanCentral AmericaChileChinaColombiaCongoCosta RicaCroatiaCubaCzechoslovakiaDenmarkDominicaDominican RepublicEastern AfricaEastern AsiaEastern EuropeEcuadorEgyptEl SalvadorEnglandEritreaEthiopiaEuropeFijiFranceGermanyGhanaGreeceGrenadaGuatemalaGuyanaHaitiHondurasHong KongHungaryIndiaIndonesiaIranIraqIrelandIsraelItalyJamaicaJapanJordanKazakhstanKenyaKoreaKuwaitLaosLatin AmericaLatviaLebanonLiberiaLithuaniaMalaysiaMexicoMicronesiaMiddle AfricaMoldovaMoroccoNepalNetherlandsNicaraguaNigeriaNorth AmericaNorth MacedoniaNorthern AfricaNorthern EuropeNorwayOceaniaPakistanPanamaPeruPhilippinesPolandPortugalRomaniaRussiaSaudi ArabiaScotlandSenegalSerbiaSierra LeoneSingaporeSomaliaSouth AfricaSouth AmericaSouth Central AsiaSouth Eastern AsiaSouthern EuropeSpainSri LankaSt. Vincent and the GrenadinesSudanSwedenSwitzerlandSyriaTaiwanThailandTrinidad and TobagoTurkeyUgandaUkraineUruguayUzbekistanVenezuelaVietnamWest IndiesWestern AfricaWestern AsiaWestern EuropeYemenZaireZimbabweAzores
Householder Income Under 25 years
Income
Poverty
Unemployment
Labor Participation
Family Structure
Vehicle Availability
Education Level
Disability

Householder Income Under 25 years Comparison

Mexican American Indians

Syrians

Fair
Poor
$51,783
HOUSEHOLDER INCOME UNDER 25 YEARS
27.0/ 100
METRIC RATING
183rd/ 347
METRIC RANK
$51,353
HOUSEHOLDER INCOME UNDER 25 YEARS
11.4/ 100
METRIC RATING
209th/ 347
METRIC RANK

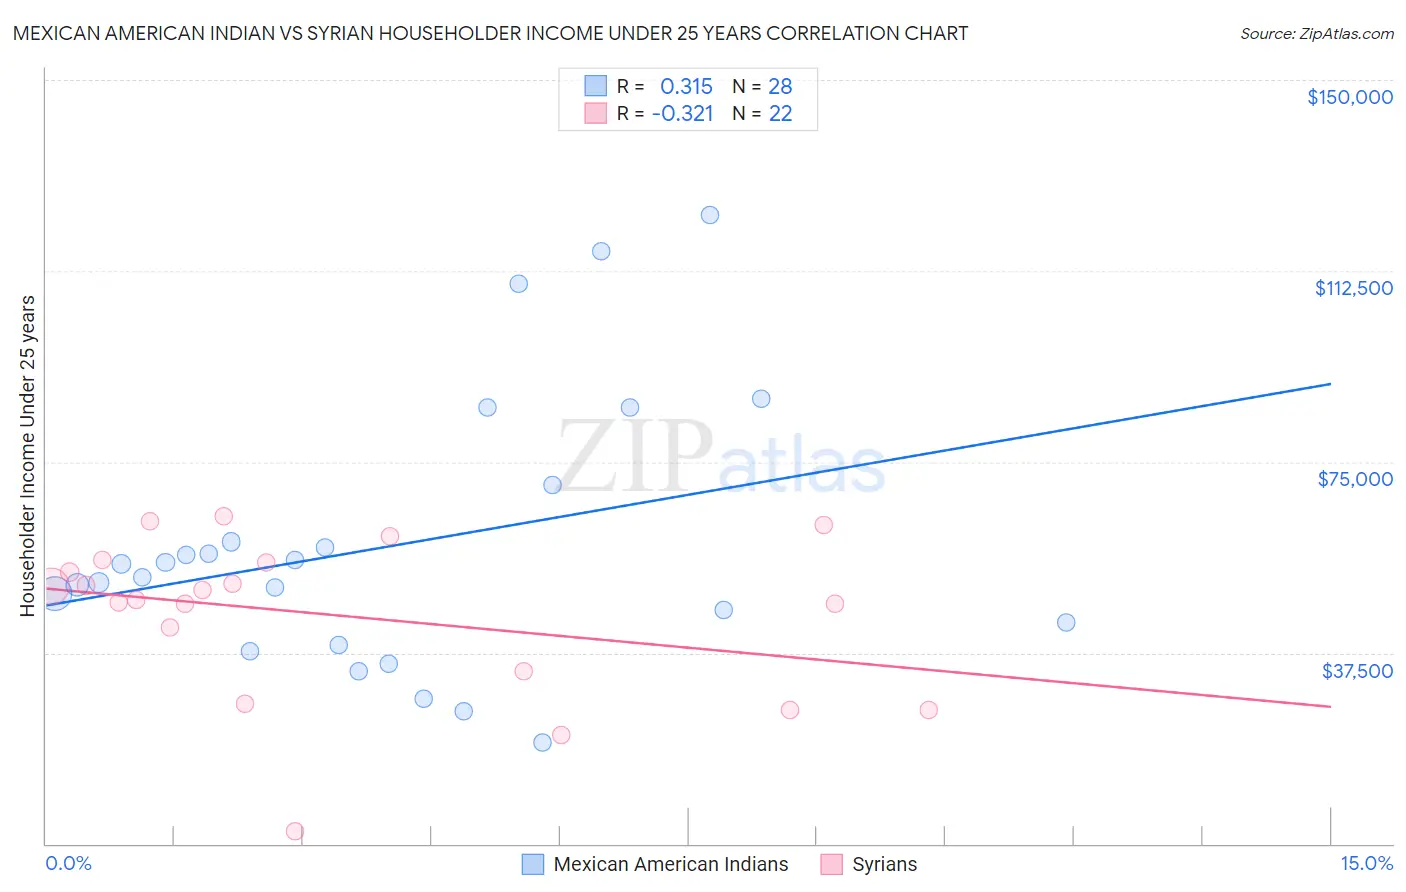
Mexican American Indian vs Syrian Householder Income Under 25 years Correlation Chart

The statistical analysis conducted on geographies consisting of 281,148,654 people shows a mild positive correlation between the proportion of Mexican American Indians and household income with householder under the age of 25 in the United States with a correlation coefficient (R) of 0.315 and weighted average of $51,783. Similarly, the statistical analysis conducted on geographies consisting of 232,232,125 people shows a mild negative correlation between the proportion of Syrians and household income with householder under the age of 25 in the United States with a correlation coefficient (R) of -0.321 and weighted average of $51,353, a difference of 0.84%.
Mexican American Indian vs Syrian Householder Income Under 25 years

Householder Income Under 25 years Correlation Summary

MeasurementMexican American IndianSyrian
Minimum$20,000$2,499
Maximum$123,444$64,366
Range$103,444$61,867
Mean$58,543$44,870
Median$53,633$48,867
Interquartile 25% (IQ1)$41,184$33,995
Interquartile 75% (IQ3)$64,825$55,261
Interquartile Range (IQR)$23,640$21,267
Standard Deviation (Sample)$26,373$15,709
Standard Deviation (Population)$25,898$15,348

Similar Demographics by Householder Income Under 25 years

Demographics Similar to Mexican American Indians by Householder Income Under 25 years

In terms of householder income under 25 years, the demographic groups most similar to Mexican American Indians are European ($51,796, a difference of 0.030%), Jordanian ($51,796, a difference of 0.030%), Basque ($51,818, a difference of 0.070%), Immigrants from England ($51,817, a difference of 0.070%), and Paiute ($51,743, a difference of 0.080%).
DemographicsRating | RankHouseholder Income Under 25 years
Austrians
32.9
/100
|
#176
Fair
$51,898
British West Indians
30.0
/100
|
#177
Fair
$51,844
Finns
29.2
/100
|
#178
Fair
$51,827
Basques
28.7
/100
|
#179
Fair
$51,818
Immigrants | England
28.7
/100
|
#180
Fair
$51,817
Europeans
27.6
/100
|
#181
Fair
$51,796
Jordanians
27.6
/100
|
#182
Fair
$51,796
Mexican American Indians
27.0
/100
|
#183
Fair
$51,783
Paiute
25.1
/100
|
#184
Fair
$51,743
Immigrants | Latvia
24.8
/100
|
#185
Fair
$51,737
Alaskan Athabascans
23.8
/100
|
#186
Fair
$51,713
Immigrants | South Africa
23.4
/100
|
#187
Fair
$51,705
Northern Europeans
22.2
/100
|
#188
Fair
$51,678
Croatians
21.6
/100
|
#189
Fair
$51,662
Malaysians
19.7
/100
|
#190
Poor
$51,615

Demographics Similar to Syrians by Householder Income Under 25 years

In terms of householder income under 25 years, the demographic groups most similar to Syrians are Immigrants from Jordan ($51,370, a difference of 0.030%), Immigrants from Ghana ($51,333, a difference of 0.040%), South African ($51,383, a difference of 0.060%), Cape Verdean ($51,387, a difference of 0.070%), and Immigrants from Latin America ($51,387, a difference of 0.070%).
DemographicsRating | RankHouseholder Income Under 25 years
Immigrants | Guatemala
14.0
/100
|
#202
Poor
$51,447
Immigrants | Cameroon
13.6
/100
|
#203
Poor
$51,433
Czechs
13.2
/100
|
#204
Poor
$51,421
Cape Verdeans
12.3
/100
|
#205
Poor
$51,387
Immigrants | Latin America
12.3
/100
|
#206
Poor
$51,387
South Africans
12.2
/100
|
#207
Poor
$51,383
Immigrants | Jordan
11.9
/100
|
#208
Poor
$51,370
Syrians
11.4
/100
|
#209
Poor
$51,353
Immigrants | Ghana
10.9
/100
|
#210
Poor
$51,333
Irish
10.6
/100
|
#211
Poor
$51,317
Immigrants | Panama
9.7
/100
|
#212
Tragic
$51,278
Dutch
9.4
/100
|
#213
Tragic
$51,265
Zimbabweans
9.3
/100
|
#214
Tragic
$51,259
Icelanders
9.1
/100
|
#215
Tragic
$51,247
French
8.7
/100
|
#216
Tragic
$51,230