Immigrants from Congo vs Syrian Householder Income Under 25 years
COMPARE
Immigrants from Congo
Syrian
Householder Income Under 25 years
Householder Income Under 25 years Comparison
Immigrants from Congo
Syrians
$43,266
HOUSEHOLDER INCOME UNDER 25 YEARS
0.0/ 100
METRIC RATING
344th/ 347
METRIC RANK
$51,353
HOUSEHOLDER INCOME UNDER 25 YEARS
11.4/ 100
METRIC RATING
209th/ 347
METRIC RANK
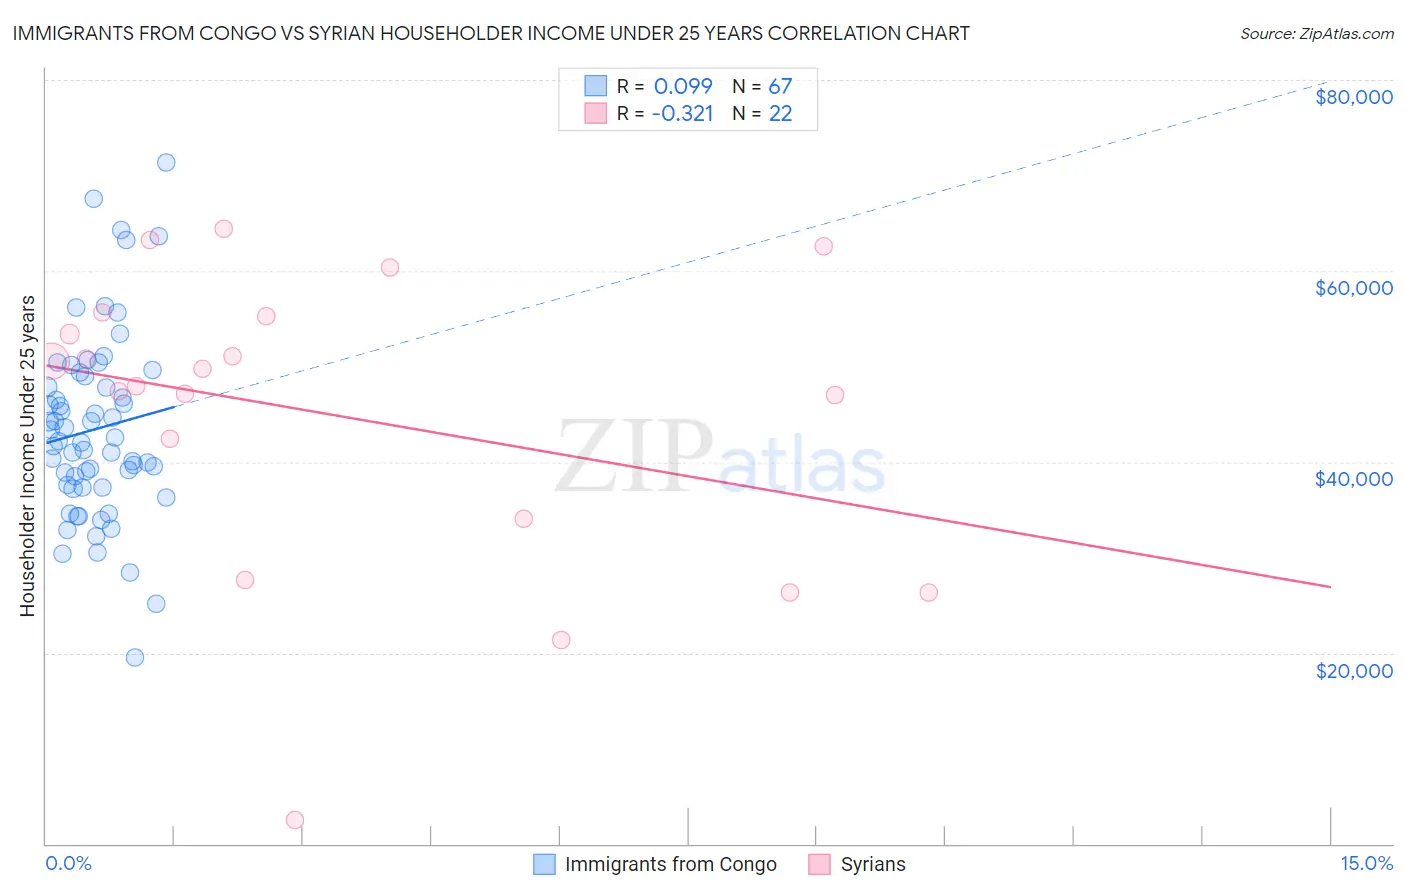
Immigrants from Congo vs Syrian Householder Income Under 25 years Correlation Chart
The statistical analysis conducted on geographies consisting of 88,830,669 people shows a slight positive correlation between the proportion of Immigrants from Congo and household income with householder under the age of 25 in the United States with a correlation coefficient (R) of 0.099 and weighted average of $43,266. Similarly, the statistical analysis conducted on geographies consisting of 232,232,125 people shows a mild negative correlation between the proportion of Syrians and household income with householder under the age of 25 in the United States with a correlation coefficient (R) of -0.321 and weighted average of $51,353, a difference of 18.7%.
Householder Income Under 25 years Correlation Summary
| Measurement | Immigrants from Congo | Syrian |
| Minimum | $19,500 | $2,499 |
| Maximum | $71,336 | $64,366 |
| Range | $51,836 | $61,867 |
| Mean | $43,427 | $44,870 |
| Median | $42,211 | $48,867 |
| Interquartile 25% (IQ1) | $37,374 | $33,995 |
| Interquartile 75% (IQ3) | $48,976 | $55,261 |
| Interquartile Range (IQR) | $11,602 | $21,267 |
| Standard Deviation (Sample) | $9,717 | $15,709 |
| Standard Deviation (Population) | $9,644 | $15,348 |
Similar Demographics by Householder Income Under 25 years
Demographics Similar to Immigrants from Congo by Householder Income Under 25 years
In terms of householder income under 25 years, the demographic groups most similar to Immigrants from Congo are Immigrants from Yemen ($43,591, a difference of 0.75%), Arapaho ($44,003, a difference of 1.7%), Navajo ($42,380, a difference of 2.1%), Houma ($44,356, a difference of 2.5%), and Black/African American ($44,381, a difference of 2.6%).
| Demographics | Rating | Rank | Householder Income Under 25 years |
| Creek | 0.0 /100 | #333 | Tragic $45,371 |
| Cajuns | 0.0 /100 | #334 | Tragic $45,338 |
| Cheyenne | 0.0 /100 | #335 | Tragic $45,275 |
| Tohono O'odham | 0.0 /100 | #336 | Tragic $45,248 |
| Pueblo | 0.0 /100 | #337 | Tragic $45,018 |
| Chickasaw | 0.0 /100 | #338 | Tragic $44,763 |
| Kiowa | 0.0 /100 | #339 | Tragic $44,733 |
| Blacks/African Americans | 0.0 /100 | #340 | Tragic $44,381 |
| Houma | 0.0 /100 | #341 | Tragic $44,356 |
| Arapaho | 0.0 /100 | #342 | Tragic $44,003 |
| Immigrants | Yemen | 0.0 /100 | #343 | Tragic $43,591 |
| Immigrants | Congo | 0.0 /100 | #344 | Tragic $43,266 |
| Navajo | 0.0 /100 | #345 | Tragic $42,380 |
| Puerto Ricans | 0.0 /100 | #346 | Tragic $39,726 |
| Lumbee | 0.0 /100 | #347 | Tragic $34,584 |
Demographics Similar to Syrians by Householder Income Under 25 years
In terms of householder income under 25 years, the demographic groups most similar to Syrians are Immigrants from Jordan ($51,370, a difference of 0.030%), Immigrants from Ghana ($51,333, a difference of 0.040%), South African ($51,383, a difference of 0.060%), Cape Verdean ($51,387, a difference of 0.070%), and Immigrants from Latin America ($51,387, a difference of 0.070%).
| Demographics | Rating | Rank | Householder Income Under 25 years |
| Immigrants | Guatemala | 14.0 /100 | #202 | Poor $51,447 |
| Immigrants | Cameroon | 13.6 /100 | #203 | Poor $51,433 |
| Czechs | 13.2 /100 | #204 | Poor $51,421 |
| Cape Verdeans | 12.3 /100 | #205 | Poor $51,387 |
| Immigrants | Latin America | 12.3 /100 | #206 | Poor $51,387 |
| South Africans | 12.2 /100 | #207 | Poor $51,383 |
| Immigrants | Jordan | 11.9 /100 | #208 | Poor $51,370 |
| Syrians | 11.4 /100 | #209 | Poor $51,353 |
| Immigrants | Ghana | 10.9 /100 | #210 | Poor $51,333 |
| Irish | 10.6 /100 | #211 | Poor $51,317 |
| Immigrants | Panama | 9.7 /100 | #212 | Tragic $51,278 |
| Dutch | 9.4 /100 | #213 | Tragic $51,265 |
| Zimbabweans | 9.3 /100 | #214 | Tragic $51,259 |
| Icelanders | 9.1 /100 | #215 | Tragic $51,247 |
| French | 8.7 /100 | #216 | Tragic $51,230 |