Malaysian vs Syrian Householder Income Under 25 years
COMPARE
Malaysian
Syrian
Householder Income Under 25 years
Householder Income Under 25 years Comparison
Malaysians
Syrians
$51,615
HOUSEHOLDER INCOME UNDER 25 YEARS
19.7/ 100
METRIC RATING
190th/ 347
METRIC RANK
$51,353
HOUSEHOLDER INCOME UNDER 25 YEARS
11.4/ 100
METRIC RATING
209th/ 347
METRIC RANK
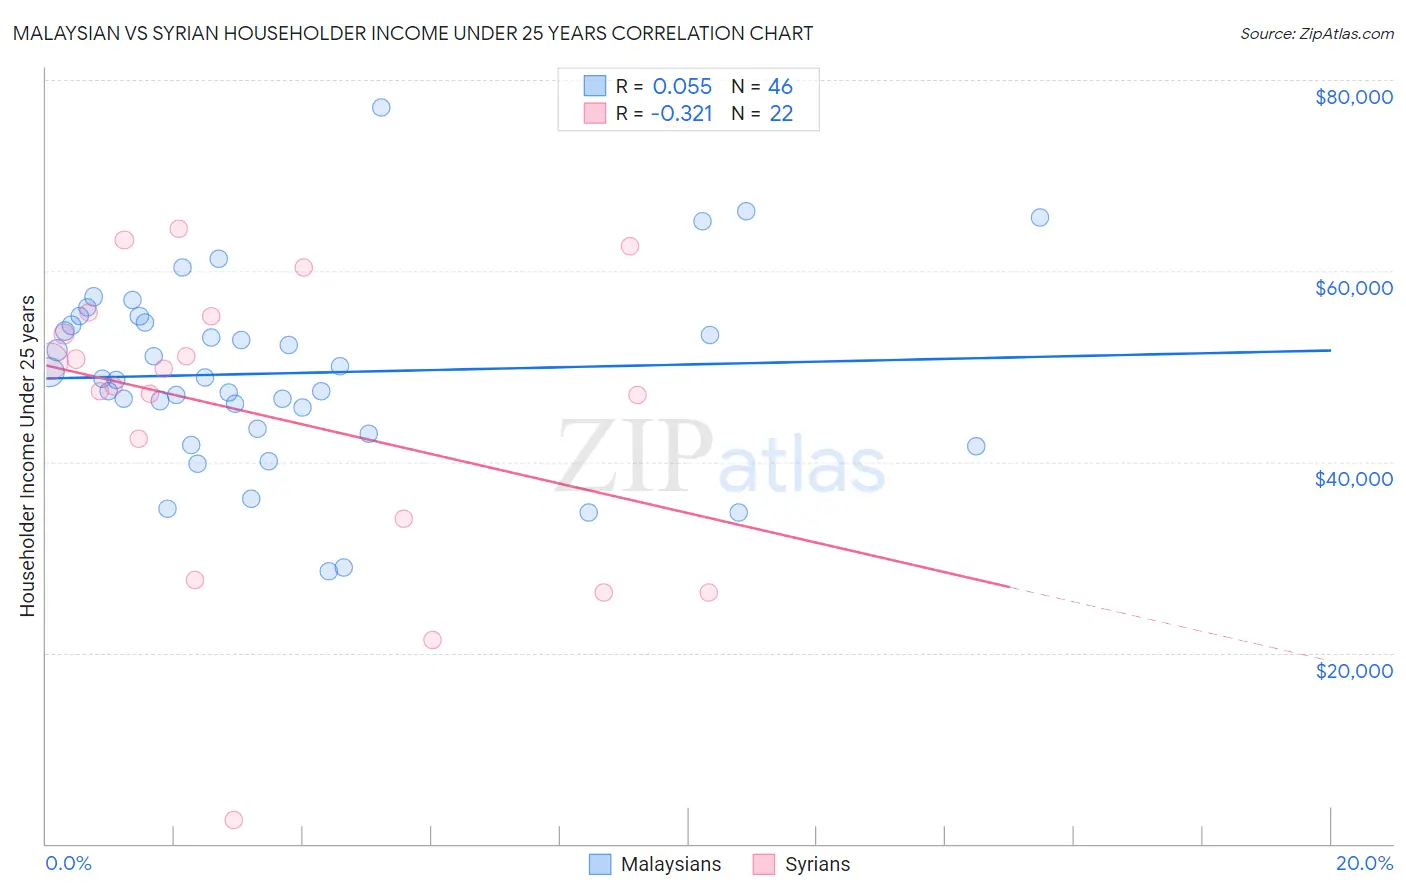
Malaysian vs Syrian Householder Income Under 25 years Correlation Chart
The statistical analysis conducted on geographies consisting of 207,003,790 people shows a slight positive correlation between the proportion of Malaysians and household income with householder under the age of 25 in the United States with a correlation coefficient (R) of 0.055 and weighted average of $51,615. Similarly, the statistical analysis conducted on geographies consisting of 232,232,125 people shows a mild negative correlation between the proportion of Syrians and household income with householder under the age of 25 in the United States with a correlation coefficient (R) of -0.321 and weighted average of $51,353, a difference of 0.51%.
Householder Income Under 25 years Correlation Summary
| Measurement | Malaysian | Syrian |
| Minimum | $28,500 | $2,499 |
| Maximum | $77,081 | $64,366 |
| Range | $48,581 | $61,867 |
| Mean | $49,286 | $44,870 |
| Median | $48,791 | $48,867 |
| Interquartile 25% (IQ1) | $43,424 | $33,995 |
| Interquartile 75% (IQ3) | $54,664 | $55,261 |
| Interquartile Range (IQR) | $11,240 | $21,267 |
| Standard Deviation (Sample) | $9,769 | $15,709 |
| Standard Deviation (Population) | $9,663 | $15,348 |
Demographics Similar to Malaysians and Syrians by Householder Income Under 25 years
In terms of householder income under 25 years, the demographic groups most similar to Malaysians are Panamanian ($51,611, a difference of 0.010%), West Indian ($51,583, a difference of 0.060%), Immigrants from Eritrea ($51,574, a difference of 0.080%), Croatian ($51,662, a difference of 0.090%), and Guatemalan ($51,525, a difference of 0.17%). Similarly, the demographic groups most similar to Syrians are Immigrants from Jordan ($51,370, a difference of 0.030%), South African ($51,383, a difference of 0.060%), Cape Verdean ($51,387, a difference of 0.070%), Immigrants from Latin America ($51,387, a difference of 0.070%), and Czech ($51,421, a difference of 0.13%).
| Demographics | Rating | Rank | Householder Income Under 25 years |
| Croatians | 21.6 /100 | #189 | Fair $51,662 |
| Malaysians | 19.7 /100 | #190 | Poor $51,615 |
| Panamanians | 19.5 /100 | #191 | Poor $51,611 |
| West Indians | 18.5 /100 | #192 | Poor $51,583 |
| Immigrants | Eritrea | 18.1 /100 | #193 | Poor $51,574 |
| Guatemalans | 16.4 /100 | #194 | Poor $51,525 |
| Estonians | 16.4 /100 | #195 | Poor $51,523 |
| Palestinians | 16.1 /100 | #196 | Poor $51,515 |
| Pima | 15.7 /100 | #197 | Poor $51,503 |
| Immigrants | Syria | 15.4 /100 | #198 | Poor $51,494 |
| Swiss | 15.4 /100 | #199 | Poor $51,493 |
| Immigrants | West Indies | 14.9 /100 | #200 | Poor $51,479 |
| British | 14.9 /100 | #201 | Poor $51,477 |
| Immigrants | Guatemala | 14.0 /100 | #202 | Poor $51,447 |
| Immigrants | Cameroon | 13.6 /100 | #203 | Poor $51,433 |
| Czechs | 13.2 /100 | #204 | Poor $51,421 |
| Cape Verdeans | 12.3 /100 | #205 | Poor $51,387 |
| Immigrants | Latin America | 12.3 /100 | #206 | Poor $51,387 |
| South Africans | 12.2 /100 | #207 | Poor $51,383 |
| Immigrants | Jordan | 11.9 /100 | #208 | Poor $51,370 |
| Syrians | 11.4 /100 | #209 | Poor $51,353 |