Kiowa vs American Householder Income Over 65 years
COMPARE
Kiowa
American
Householder Income Over 65 years
Householder Income Over 65 years Comparison
Kiowa
Americans
$51,140
HOUSEHOLDER INCOME OVER 65 YEARS
0.0/ 100
METRIC RATING
326th/ 347
METRIC RANK
$55,527
HOUSEHOLDER INCOME OVER 65 YEARS
0.3/ 100
METRIC RATING
254th/ 347
METRIC RANK
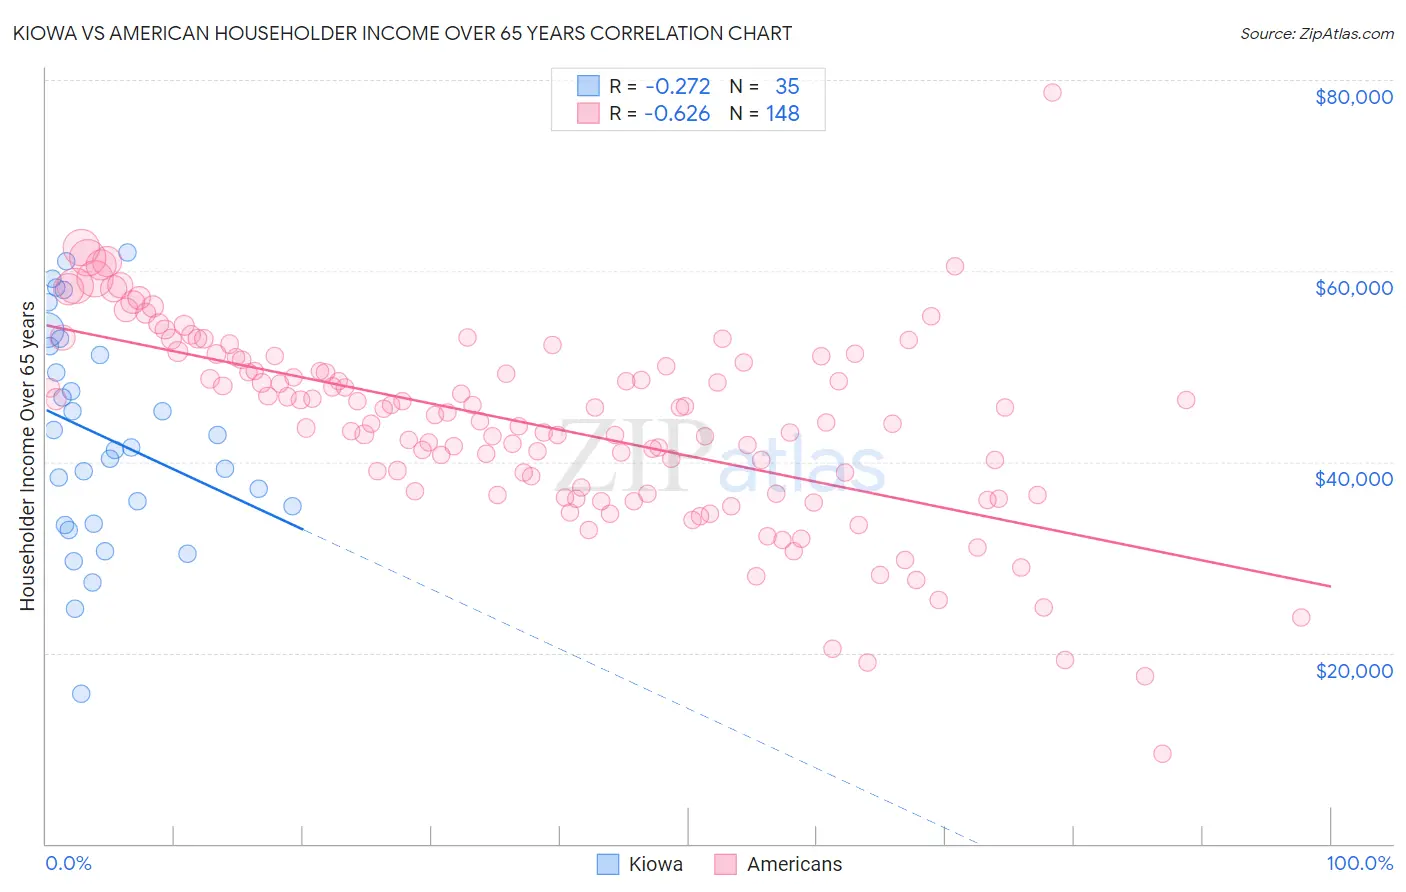
Kiowa vs American Householder Income Over 65 years Correlation Chart
The statistical analysis conducted on geographies consisting of 56,056,100 people shows a weak negative correlation between the proportion of Kiowa and household income with householder over the age of 65 in the United States with a correlation coefficient (R) of -0.272 and weighted average of $51,140. Similarly, the statistical analysis conducted on geographies consisting of 575,586,955 people shows a significant negative correlation between the proportion of Americans and household income with householder over the age of 65 in the United States with a correlation coefficient (R) of -0.626 and weighted average of $55,527, a difference of 8.6%.
Householder Income Over 65 years Correlation Summary
| Measurement | Kiowa | American |
| Minimum | $15,714 | $9,474 |
| Maximum | $61,875 | $78,750 |
| Range | $46,161 | $69,276 |
| Mean | $42,635 | $43,883 |
| Median | $41,563 | $45,063 |
| Interquartile 25% (IQ1) | $33,542 | $36,777 |
| Interquartile 75% (IQ3) | $52,128 | $50,543 |
| Interquartile Range (IQR) | $18,586 | $13,765 |
| Standard Deviation (Sample) | $11,308 | $10,175 |
| Standard Deviation (Population) | $11,146 | $10,140 |
Similar Demographics by Householder Income Over 65 years
Demographics Similar to Kiowa by Householder Income Over 65 years
In terms of householder income over 65 years, the demographic groups most similar to Kiowa are Immigrants from Haiti ($51,219, a difference of 0.15%), Bahamian ($51,000, a difference of 0.28%), Hopi ($50,925, a difference of 0.42%), Immigrants from Congo ($51,393, a difference of 0.49%), and Cajun ($51,397, a difference of 0.50%).
| Demographics | Rating | Rank | Householder Income Over 65 years |
| Immigrants | Honduras | 0.0 /100 | #319 | Tragic $51,888 |
| Colville | 0.0 /100 | #320 | Tragic $51,739 |
| Menominee | 0.0 /100 | #321 | Tragic $51,719 |
| British West Indians | 0.0 /100 | #322 | Tragic $51,463 |
| Cajuns | 0.0 /100 | #323 | Tragic $51,397 |
| Immigrants | Congo | 0.0 /100 | #324 | Tragic $51,393 |
| Immigrants | Haiti | 0.0 /100 | #325 | Tragic $51,219 |
| Kiowa | 0.0 /100 | #326 | Tragic $51,140 |
| Bahamians | 0.0 /100 | #327 | Tragic $51,000 |
| Hopi | 0.0 /100 | #328 | Tragic $50,925 |
| Blacks/African Americans | 0.0 /100 | #329 | Tragic $50,779 |
| Immigrants | Grenada | 0.0 /100 | #330 | Tragic $50,747 |
| Pima | 0.0 /100 | #331 | Tragic $50,539 |
| Dutch West Indians | 0.0 /100 | #332 | Tragic $50,475 |
| Cape Verdeans | 0.0 /100 | #333 | Tragic $50,077 |
Demographics Similar to Americans by Householder Income Over 65 years
In terms of householder income over 65 years, the demographic groups most similar to Americans are Immigrants from Trinidad and Tobago ($55,598, a difference of 0.13%), Immigrants from Bangladesh ($55,394, a difference of 0.24%), Osage ($55,677, a difference of 0.27%), German Russian ($55,356, a difference of 0.31%), and Trinidadian and Tobagonian ($55,327, a difference of 0.36%).
| Demographics | Rating | Rank | Householder Income Over 65 years |
| Yakama | 0.7 /100 | #247 | Tragic $56,234 |
| Vietnamese | 0.6 /100 | #248 | Tragic $56,143 |
| Mexican American Indians | 0.6 /100 | #249 | Tragic $56,089 |
| Immigrants | Bosnia and Herzegovina | 0.5 /100 | #250 | Tragic $55,986 |
| Immigrants | Portugal | 0.5 /100 | #251 | Tragic $55,924 |
| Osage | 0.4 /100 | #252 | Tragic $55,677 |
| Immigrants | Trinidad and Tobago | 0.4 /100 | #253 | Tragic $55,598 |
| Americans | 0.3 /100 | #254 | Tragic $55,527 |
| Immigrants | Bangladesh | 0.3 /100 | #255 | Tragic $55,394 |
| German Russians | 0.3 /100 | #256 | Tragic $55,356 |
| Trinidadians and Tobagonians | 0.3 /100 | #257 | Tragic $55,327 |
| Ecuadorians | 0.2 /100 | #258 | Tragic $54,958 |
| West Indians | 0.2 /100 | #259 | Tragic $54,936 |
| Immigrants | West Indies | 0.2 /100 | #260 | Tragic $54,927 |
| Comanche | 0.2 /100 | #261 | Tragic $54,922 |