Kiowa vs Seminole Householder Income Over 65 years
COMPARE
Kiowa
Seminole
Householder Income Over 65 years
Householder Income Over 65 years Comparison
Kiowa
Seminole
$51,140
HOUSEHOLDER INCOME OVER 65 YEARS
0.0/ 100
METRIC RATING
326th/ 347
METRIC RANK
$52,373
HOUSEHOLDER INCOME OVER 65 YEARS
0.0/ 100
METRIC RATING
311th/ 347
METRIC RANK
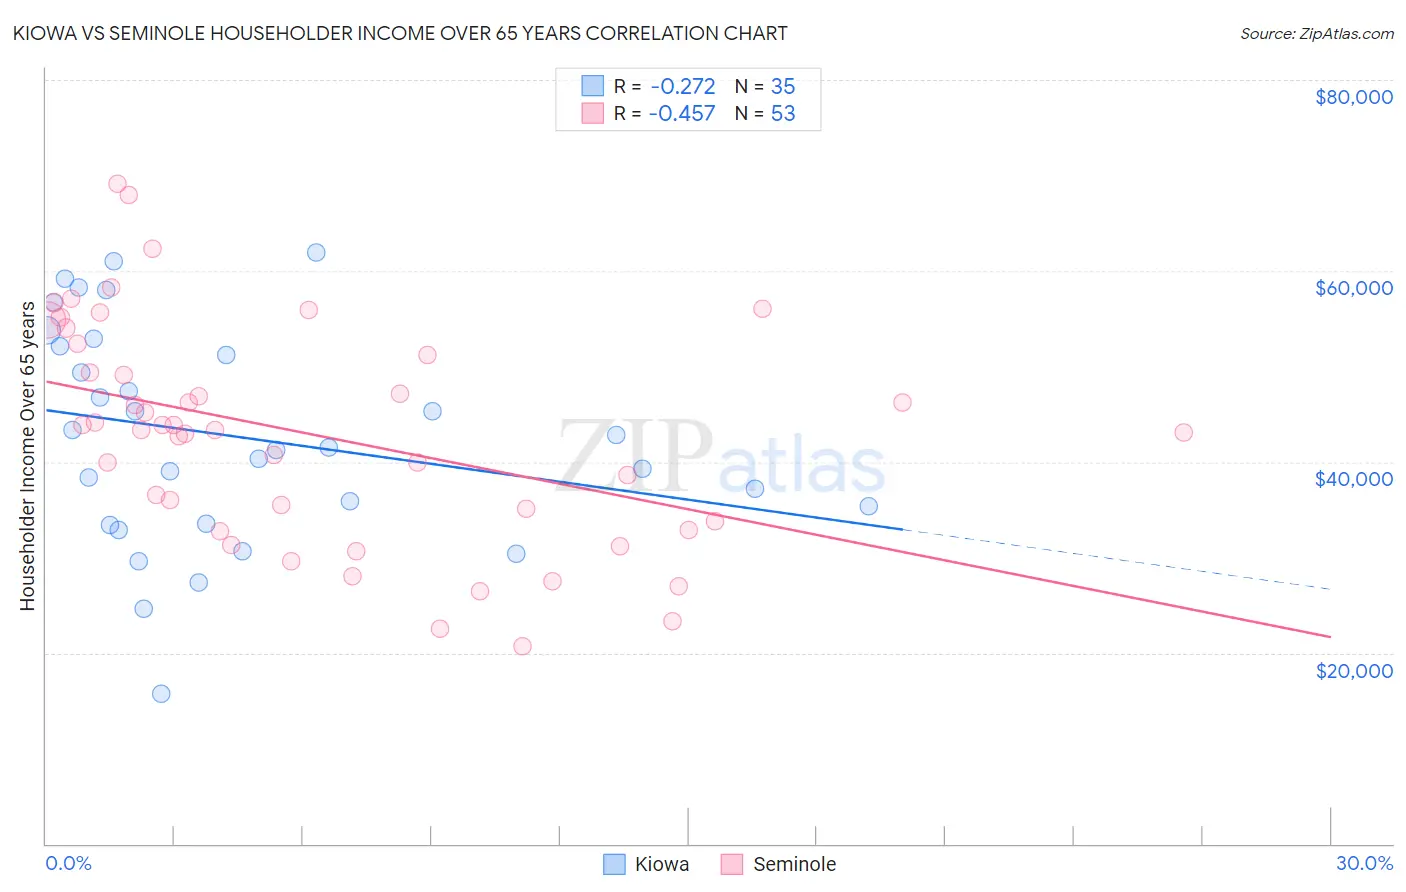
Kiowa vs Seminole Householder Income Over 65 years Correlation Chart
The statistical analysis conducted on geographies consisting of 56,056,100 people shows a weak negative correlation between the proportion of Kiowa and household income with householder over the age of 65 in the United States with a correlation coefficient (R) of -0.272 and weighted average of $51,140. Similarly, the statistical analysis conducted on geographies consisting of 118,149,941 people shows a moderate negative correlation between the proportion of Seminole and household income with householder over the age of 65 in the United States with a correlation coefficient (R) of -0.457 and weighted average of $52,373, a difference of 2.4%.
Householder Income Over 65 years Correlation Summary
| Measurement | Kiowa | Seminole |
| Minimum | $15,714 | $20,714 |
| Maximum | $61,875 | $69,068 |
| Range | $46,161 | $48,354 |
| Mean | $42,635 | $42,904 |
| Median | $41,563 | $43,396 |
| Interquartile 25% (IQ1) | $33,542 | $33,309 |
| Interquartile 75% (IQ3) | $52,128 | $51,804 |
| Interquartile Range (IQR) | $18,586 | $18,495 |
| Standard Deviation (Sample) | $11,308 | $11,569 |
| Standard Deviation (Population) | $11,146 | $11,460 |
Demographics Similar to Kiowa and Seminole by Householder Income Over 65 years
In terms of householder income over 65 years, the demographic groups most similar to Kiowa are Immigrants from Haiti ($51,219, a difference of 0.15%), Bahamian ($51,000, a difference of 0.28%), Hopi ($50,925, a difference of 0.42%), Immigrants from Congo ($51,393, a difference of 0.49%), and Cajun ($51,397, a difference of 0.50%). Similarly, the demographic groups most similar to Seminole are Sioux ($52,509, a difference of 0.26%), Immigrants from the Azores ($52,121, a difference of 0.48%), Honduran ($52,634, a difference of 0.50%), Immigrants from Nicaragua ($52,085, a difference of 0.55%), and Native/Alaskan ($52,081, a difference of 0.56%).
| Demographics | Rating | Rank | Householder Income Over 65 years |
| Immigrants | Mexico | 0.0 /100 | #308 | Tragic $52,801 |
| Hondurans | 0.0 /100 | #309 | Tragic $52,634 |
| Sioux | 0.0 /100 | #310 | Tragic $52,509 |
| Seminole | 0.0 /100 | #311 | Tragic $52,373 |
| Immigrants | Azores | 0.0 /100 | #312 | Tragic $52,121 |
| Immigrants | Nicaragua | 0.0 /100 | #313 | Tragic $52,085 |
| Natives/Alaskans | 0.0 /100 | #314 | Tragic $52,081 |
| U.S. Virgin Islanders | 0.0 /100 | #315 | Tragic $52,072 |
| Creek | 0.0 /100 | #316 | Tragic $51,949 |
| Immigrants | St. Vincent and the Grenadines | 0.0 /100 | #317 | Tragic $51,922 |
| Haitians | 0.0 /100 | #318 | Tragic $51,912 |
| Immigrants | Honduras | 0.0 /100 | #319 | Tragic $51,888 |
| Colville | 0.0 /100 | #320 | Tragic $51,739 |
| Menominee | 0.0 /100 | #321 | Tragic $51,719 |
| British West Indians | 0.0 /100 | #322 | Tragic $51,463 |
| Cajuns | 0.0 /100 | #323 | Tragic $51,397 |
| Immigrants | Congo | 0.0 /100 | #324 | Tragic $51,393 |
| Immigrants | Haiti | 0.0 /100 | #325 | Tragic $51,219 |
| Kiowa | 0.0 /100 | #326 | Tragic $51,140 |
| Bahamians | 0.0 /100 | #327 | Tragic $51,000 |
| Hopi | 0.0 /100 | #328 | Tragic $50,925 |