Swiss vs Immigrants from Brazil Median Household Income
COMPARE
Swiss
Immigrants from Brazil
Median Household Income
Median Household Income Comparison
Swiss
Immigrants from Brazil
$85,681
MEDIAN HOUSEHOLD INCOME
59.2/ 100
METRIC RATING
170th/ 347
METRIC RANK
$90,907
MEDIAN HOUSEHOLD INCOME
97.7/ 100
METRIC RATING
105th/ 347
METRIC RANK
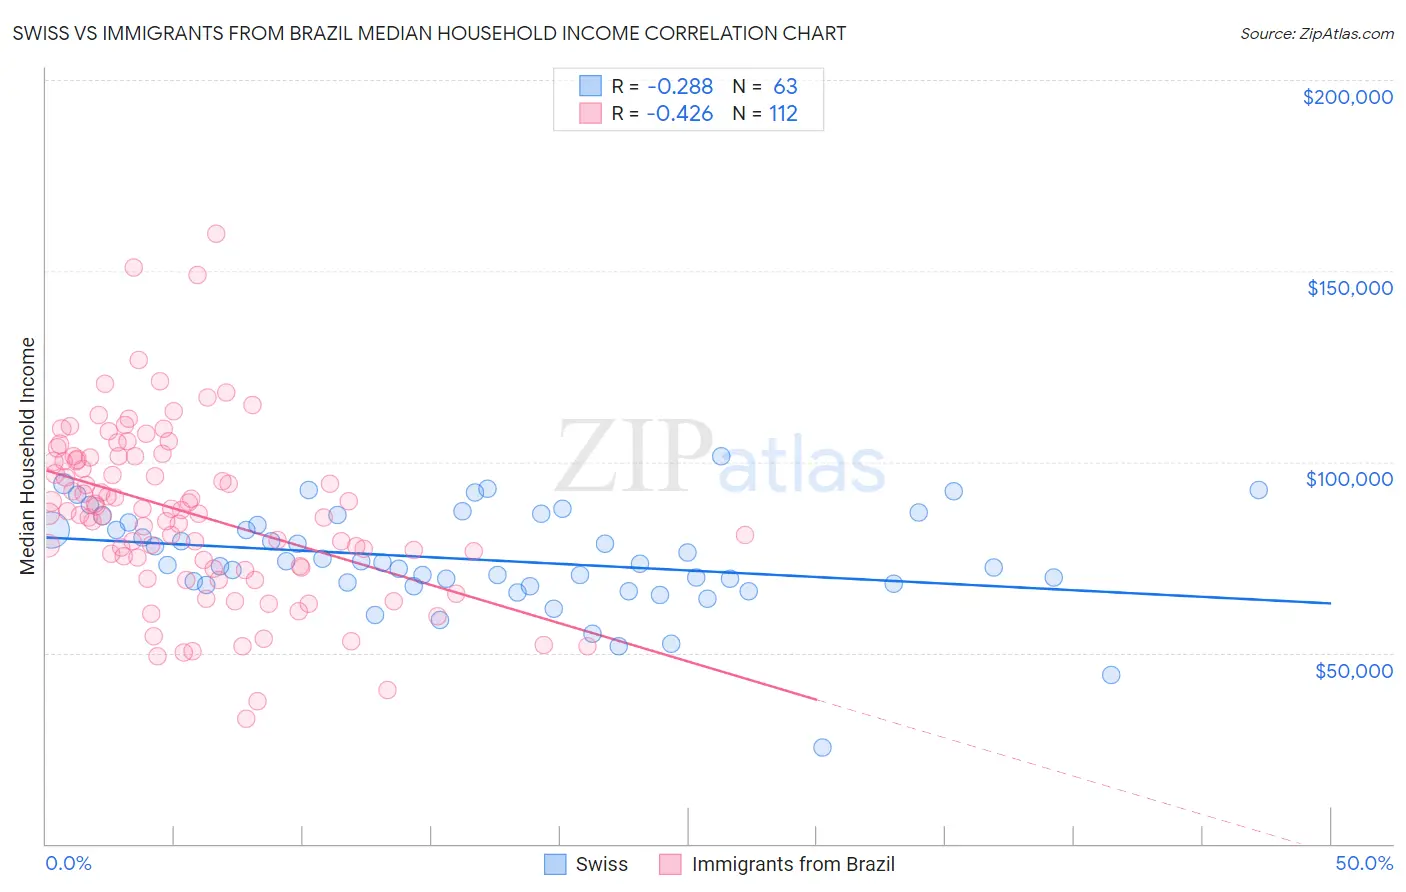
Swiss vs Immigrants from Brazil Median Household Income Correlation Chart
The statistical analysis conducted on geographies consisting of 464,626,684 people shows a weak negative correlation between the proportion of Swiss and median household income in the United States with a correlation coefficient (R) of -0.288 and weighted average of $85,681. Similarly, the statistical analysis conducted on geographies consisting of 342,806,589 people shows a moderate negative correlation between the proportion of Immigrants from Brazil and median household income in the United States with a correlation coefficient (R) of -0.426 and weighted average of $90,907, a difference of 6.1%.
Median Household Income Correlation Summary
| Measurement | Swiss | Immigrants from Brazil |
| Minimum | $25,245 | $32,591 |
| Maximum | $101,562 | $159,719 |
| Range | $76,317 | $127,128 |
| Mean | $74,409 | $86,451 |
| Median | $73,303 | $86,864 |
| Interquartile 25% (IQ1) | $67,788 | $72,377 |
| Interquartile 75% (IQ3) | $84,144 | $100,910 |
| Interquartile Range (IQR) | $16,356 | $28,533 |
| Standard Deviation (Sample) | $13,178 | $22,561 |
| Standard Deviation (Population) | $13,073 | $22,460 |
Similar Demographics by Median Household Income
Demographics Similar to Swiss by Median Household Income
In terms of median household income, the demographic groups most similar to Swiss are Colombian ($85,716, a difference of 0.040%), Immigrants from South America ($85,611, a difference of 0.080%), Icelander ($85,797, a difference of 0.14%), Slovene ($85,562, a difference of 0.14%), and Immigrants ($85,818, a difference of 0.16%).
| Demographics | Rating | Rank | Median Household Income |
| Czechs | 66.4 /100 | #163 | Good $86,164 |
| Irish | 66.2 /100 | #164 | Good $86,145 |
| Norwegians | 65.3 /100 | #165 | Good $86,084 |
| Scandinavians | 65.1 /100 | #166 | Good $86,073 |
| Immigrants | Immigrants | 61.3 /100 | #167 | Good $85,818 |
| Icelanders | 61.0 /100 | #168 | Good $85,797 |
| Colombians | 59.7 /100 | #169 | Average $85,716 |
| Swiss | 59.2 /100 | #170 | Average $85,681 |
| Immigrants | South America | 58.1 /100 | #171 | Average $85,611 |
| Slovenes | 57.4 /100 | #172 | Average $85,562 |
| Immigrants | Cameroon | 53.4 /100 | #173 | Average $85,314 |
| Scottish | 50.0 /100 | #174 | Average $85,101 |
| Immigrants | Costa Rica | 49.2 /100 | #175 | Average $85,054 |
| Alsatians | 49.2 /100 | #176 | Average $85,053 |
| Immigrants | Eritrea | 48.8 /100 | #177 | Average $85,025 |
Demographics Similar to Immigrants from Brazil by Median Household Income
In terms of median household income, the demographic groups most similar to Immigrants from Brazil are Immigrants from Kazakhstan ($91,015, a difference of 0.12%), Macedonian ($90,761, a difference of 0.16%), Immigrants from Ukraine ($91,124, a difference of 0.24%), Croatian ($90,685, a difference of 0.25%), and Zimbabwean ($90,618, a difference of 0.32%).
| Demographics | Rating | Rank | Median Household Income |
| Immigrants | Southern Europe | 98.5 /100 | #98 | Exceptional $91,605 |
| Immigrants | South Eastern Asia | 98.4 /100 | #99 | Exceptional $91,541 |
| Ukrainians | 98.3 /100 | #100 | Exceptional $91,456 |
| Immigrants | Moldova | 98.3 /100 | #101 | Exceptional $91,446 |
| Austrians | 98.2 /100 | #102 | Exceptional $91,339 |
| Immigrants | Ukraine | 98.0 /100 | #103 | Exceptional $91,124 |
| Immigrants | Kazakhstan | 97.8 /100 | #104 | Exceptional $91,015 |
| Immigrants | Brazil | 97.7 /100 | #105 | Exceptional $90,907 |
| Macedonians | 97.4 /100 | #106 | Exceptional $90,761 |
| Croatians | 97.3 /100 | #107 | Exceptional $90,685 |
| Zimbabweans | 97.2 /100 | #108 | Exceptional $90,618 |
| Chileans | 97.2 /100 | #109 | Exceptional $90,605 |
| Palestinians | 97.1 /100 | #110 | Exceptional $90,574 |
| Immigrants | Poland | 97.1 /100 | #111 | Exceptional $90,549 |
| Northern Europeans | 96.9 /100 | #112 | Exceptional $90,446 |