Immigrants from Laos vs Colville Per Capita Income
COMPARE
Immigrants from Laos
Colville
Per Capita Income
Per Capita Income Comparison
Immigrants from Laos
Colville
$37,857
PER CAPITA INCOME
0.1/ 100
METRIC RATING
282nd/ 347
METRIC RANK
$38,047
PER CAPITA INCOME
0.2/ 100
METRIC RATING
279th/ 347
METRIC RANK
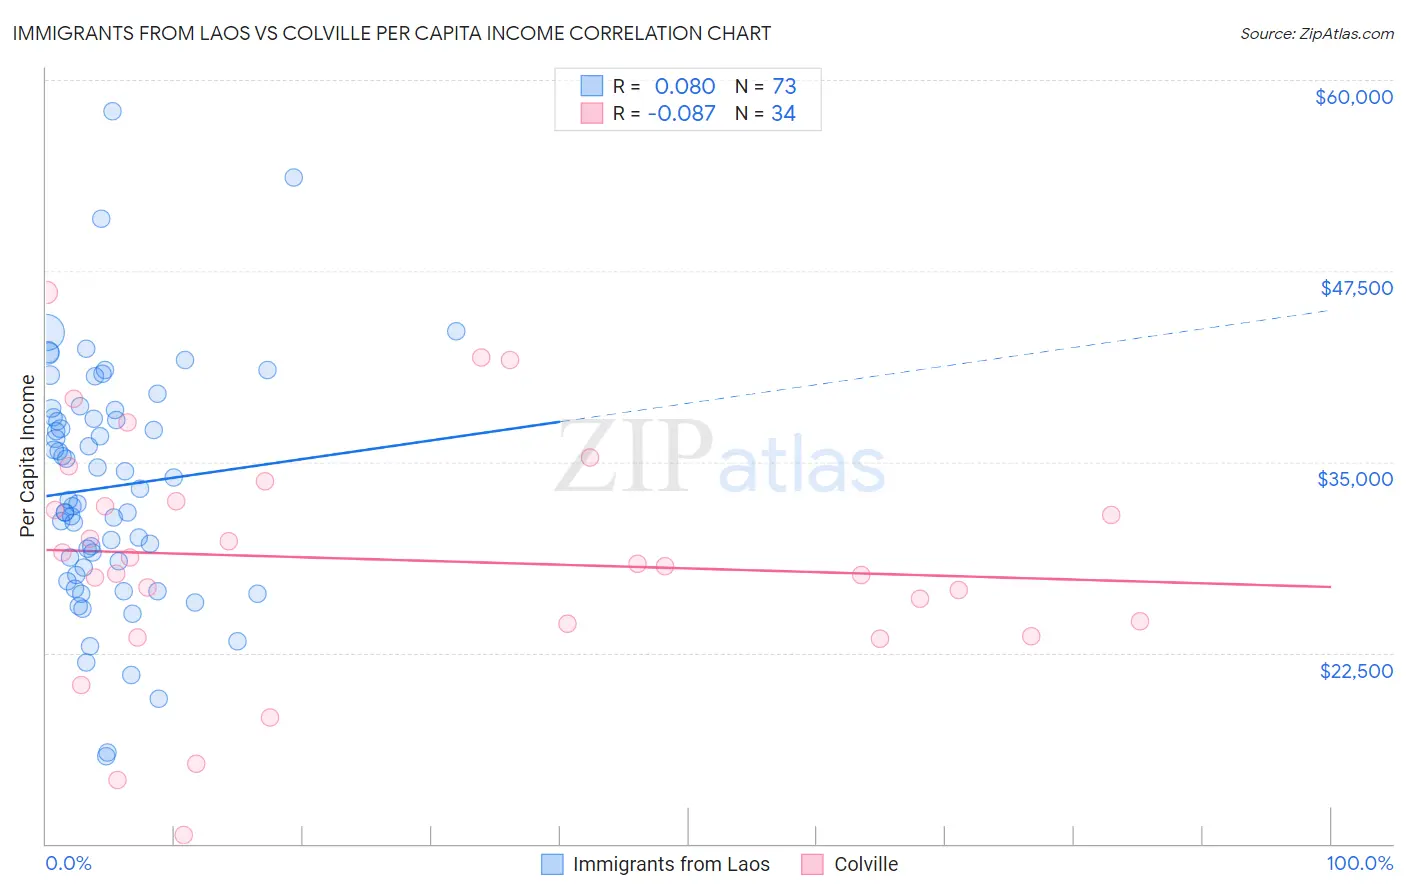
Immigrants from Laos vs Colville Per Capita Income Correlation Chart
The statistical analysis conducted on geographies consisting of 201,476,108 people shows a slight positive correlation between the proportion of Immigrants from Laos and per capita income in the United States with a correlation coefficient (R) of 0.080 and weighted average of $37,857. Similarly, the statistical analysis conducted on geographies consisting of 34,687,707 people shows a slight negative correlation between the proportion of Colville and per capita income in the United States with a correlation coefficient (R) of -0.087 and weighted average of $38,047, a difference of 0.50%.
Per Capita Income Correlation Summary
| Measurement | Immigrants from Laos | Colville |
| Minimum | $15,753 | $10,541 |
| Maximum | $57,923 | $46,065 |
| Range | $42,170 | $35,524 |
| Mean | $33,364 | $28,594 |
| Median | $32,473 | $28,215 |
| Interquartile 25% (IQ1) | $27,819 | $24,418 |
| Interquartile 75% (IQ3) | $38,151 | $32,462 |
| Interquartile Range (IQR) | $10,332 | $8,044 |
| Standard Deviation (Sample) | $7,853 | $7,817 |
| Standard Deviation (Population) | $7,799 | $7,701 |
Demographics Similar to Immigrants from Laos and Colville by Per Capita Income
In terms of per capita income, the demographic groups most similar to Immigrants from Laos are Pennsylvania German ($37,842, a difference of 0.040%), African ($37,785, a difference of 0.19%), Guatemalan ($37,766, a difference of 0.24%), Immigrants from Dominica ($37,952, a difference of 0.25%), and Central American Indian ($37,699, a difference of 0.42%). Similarly, the demographic groups most similar to Colville are Potawatomi ($38,046, a difference of 0.0%), Immigrants from Nicaragua ($38,065, a difference of 0.050%), Comanche ($38,088, a difference of 0.11%), Hmong ($38,120, a difference of 0.19%), and Immigrants from Dominica ($37,952, a difference of 0.25%).
| Demographics | Rating | Rank | Per Capita Income |
| Immigrants | Belize | 0.3 /100 | #270 | Tragic $38,614 |
| Central Americans | 0.3 /100 | #271 | Tragic $38,560 |
| Immigrants | Cabo Verde | 0.3 /100 | #272 | Tragic $38,540 |
| Nepalese | 0.3 /100 | #273 | Tragic $38,442 |
| Immigrants | El Salvador | 0.3 /100 | #274 | Tragic $38,394 |
| Immigrants | Liberia | 0.2 /100 | #275 | Tragic $38,165 |
| Hmong | 0.2 /100 | #276 | Tragic $38,120 |
| Comanche | 0.2 /100 | #277 | Tragic $38,088 |
| Immigrants | Nicaragua | 0.2 /100 | #278 | Tragic $38,065 |
| Colville | 0.2 /100 | #279 | Tragic $38,047 |
| Potawatomi | 0.2 /100 | #280 | Tragic $38,046 |
| Immigrants | Dominica | 0.2 /100 | #281 | Tragic $37,952 |
| Immigrants | Laos | 0.1 /100 | #282 | Tragic $37,857 |
| Pennsylvania Germans | 0.1 /100 | #283 | Tragic $37,842 |
| Africans | 0.1 /100 | #284 | Tragic $37,785 |
| Guatemalans | 0.1 /100 | #285 | Tragic $37,766 |
| Central American Indians | 0.1 /100 | #286 | Tragic $37,699 |
| Dominicans | 0.1 /100 | #287 | Tragic $37,697 |
| Blackfeet | 0.1 /100 | #288 | Tragic $37,695 |
| U.S. Virgin Islanders | 0.1 /100 | #289 | Tragic $37,589 |
| Immigrants | Guatemala | 0.1 /100 | #290 | Tragic $37,550 |