Potawatomi vs American Householder Income Over 65 years
COMPARE
Potawatomi
American
Householder Income Over 65 years
Householder Income Over 65 years Comparison
Potawatomi
Americans
$54,212
HOUSEHOLDER INCOME OVER 65 YEARS
0.1/ 100
METRIC RATING
272nd/ 347
METRIC RANK
$55,527
HOUSEHOLDER INCOME OVER 65 YEARS
0.3/ 100
METRIC RATING
254th/ 347
METRIC RANK
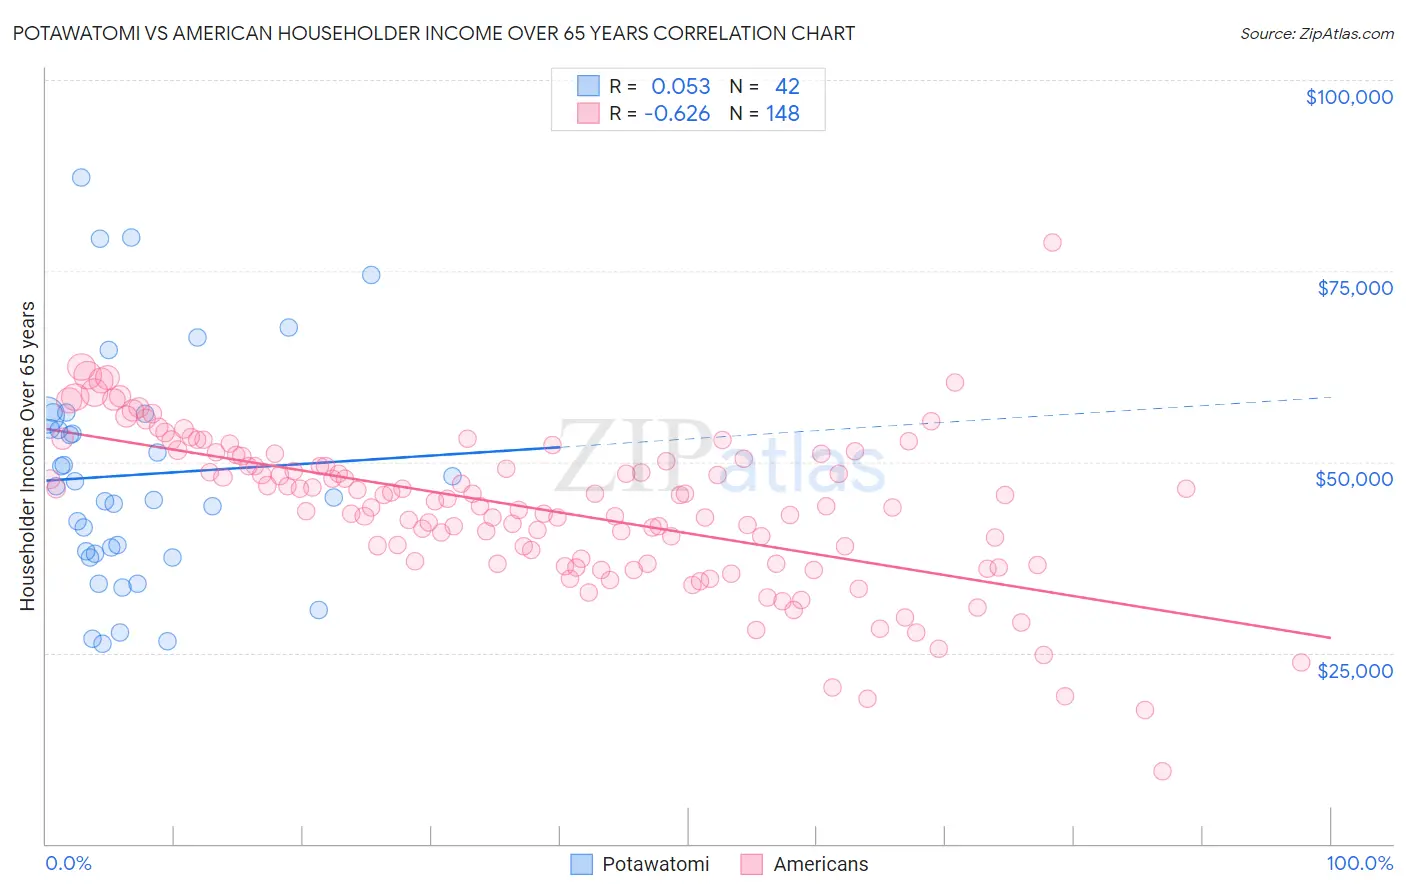
Potawatomi vs American Householder Income Over 65 years Correlation Chart
The statistical analysis conducted on geographies consisting of 117,629,291 people shows a slight positive correlation between the proportion of Potawatomi and household income with householder over the age of 65 in the United States with a correlation coefficient (R) of 0.053 and weighted average of $54,212. Similarly, the statistical analysis conducted on geographies consisting of 575,586,955 people shows a significant negative correlation between the proportion of Americans and household income with householder over the age of 65 in the United States with a correlation coefficient (R) of -0.626 and weighted average of $55,527, a difference of 2.4%.
Householder Income Over 65 years Correlation Summary
| Measurement | Potawatomi | American |
| Minimum | $26,199 | $9,474 |
| Maximum | $87,267 | $78,750 |
| Range | $61,068 | $69,276 |
| Mean | $48,291 | $43,883 |
| Median | $46,067 | $45,063 |
| Interquartile 25% (IQ1) | $38,035 | $36,777 |
| Interquartile 75% (IQ3) | $56,092 | $50,543 |
| Interquartile Range (IQR) | $18,057 | $13,765 |
| Standard Deviation (Sample) | $14,849 | $10,175 |
| Standard Deviation (Population) | $14,671 | $10,140 |
Demographics Similar to Potawatomi and Americans by Householder Income Over 65 years
In terms of householder income over 65 years, the demographic groups most similar to Potawatomi are Indonesian ($54,176, a difference of 0.070%), Liberian ($54,356, a difference of 0.27%), Immigrants from Senegal ($54,447, a difference of 0.43%), Nicaraguan ($54,474, a difference of 0.48%), and Immigrants from Zaire ($54,512, a difference of 0.55%). Similarly, the demographic groups most similar to Americans are Immigrants from Trinidad and Tobago ($55,598, a difference of 0.13%), Immigrants from Bangladesh ($55,394, a difference of 0.24%), German Russian ($55,356, a difference of 0.31%), Trinidadian and Tobagonian ($55,327, a difference of 0.36%), and Ecuadorian ($54,958, a difference of 1.0%).
| Demographics | Rating | Rank | Householder Income Over 65 years |
| Immigrants | Trinidad and Tobago | 0.4 /100 | #253 | Tragic $55,598 |
| Americans | 0.3 /100 | #254 | Tragic $55,527 |
| Immigrants | Bangladesh | 0.3 /100 | #255 | Tragic $55,394 |
| German Russians | 0.3 /100 | #256 | Tragic $55,356 |
| Trinidadians and Tobagonians | 0.3 /100 | #257 | Tragic $55,327 |
| Ecuadorians | 0.2 /100 | #258 | Tragic $54,958 |
| West Indians | 0.2 /100 | #259 | Tragic $54,936 |
| Immigrants | West Indies | 0.2 /100 | #260 | Tragic $54,927 |
| Comanche | 0.2 /100 | #261 | Tragic $54,922 |
| Bangladeshis | 0.1 /100 | #262 | Tragic $54,719 |
| French American Indians | 0.1 /100 | #263 | Tragic $54,699 |
| Apache | 0.1 /100 | #264 | Tragic $54,668 |
| Belizeans | 0.1 /100 | #265 | Tragic $54,580 |
| Jamaicans | 0.1 /100 | #266 | Tragic $54,560 |
| Guatemalans | 0.1 /100 | #267 | Tragic $54,526 |
| Immigrants | Zaire | 0.1 /100 | #268 | Tragic $54,512 |
| Nicaraguans | 0.1 /100 | #269 | Tragic $54,474 |
| Immigrants | Senegal | 0.1 /100 | #270 | Tragic $54,447 |
| Liberians | 0.1 /100 | #271 | Tragic $54,356 |
| Potawatomi | 0.1 /100 | #272 | Tragic $54,212 |
| Indonesians | 0.1 /100 | #273 | Tragic $54,176 |