Soviet Union vs Fijian Median Female Earnings
COMPARE
Soviet Union
Fijian
Median Female Earnings
Median Female Earnings Comparison
Soviet Union
Fijians
$46,556
MEDIAN FEMALE EARNINGS
100.0/ 100
METRIC RATING
14th/ 347
METRIC RANK
$35,114
MEDIAN FEMALE EARNINGS
0.0/ 100
METRIC RATING
306th/ 347
METRIC RANK
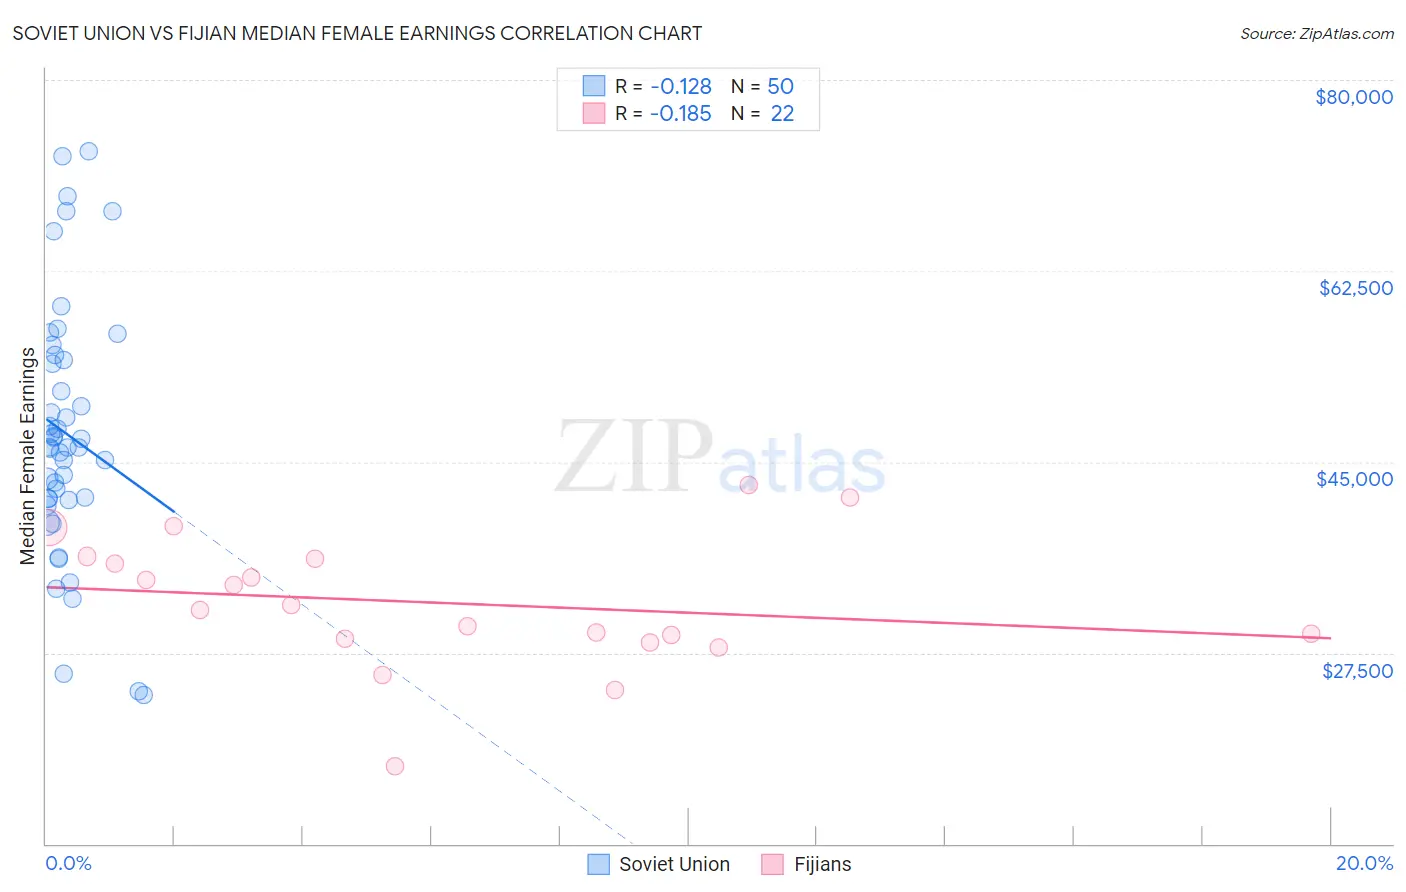
Soviet Union vs Fijian Median Female Earnings Correlation Chart
The statistical analysis conducted on geographies consisting of 43,506,452 people shows a poor negative correlation between the proportion of Soviet Union and median female earnings in the United States with a correlation coefficient (R) of -0.128 and weighted average of $46,556. Similarly, the statistical analysis conducted on geographies consisting of 55,944,407 people shows a poor negative correlation between the proportion of Fijians and median female earnings in the United States with a correlation coefficient (R) of -0.185 and weighted average of $35,114, a difference of 32.6%.
Median Female Earnings Correlation Summary
| Measurement | Soviet Union | Fijian |
| Minimum | $23,611 | $17,125 |
| Maximum | $73,520 | $42,895 |
| Range | $49,909 | $25,770 |
| Mean | $47,577 | $32,097 |
| Median | $46,321 | $31,625 |
| Interquartile 25% (IQ1) | $41,646 | $28,766 |
| Interquartile 75% (IQ3) | $54,381 | $36,076 |
| Interquartile Range (IQR) | $12,735 | $7,310 |
| Standard Deviation (Sample) | $11,528 | $6,055 |
| Standard Deviation (Population) | $11,412 | $5,916 |
Similar Demographics by Median Female Earnings
Demographics Similar to Soviet Union by Median Female Earnings
In terms of median female earnings, the demographic groups most similar to Soviet Union are Immigrants from Australia ($46,573, a difference of 0.040%), Immigrants from Eastern Asia ($46,502, a difference of 0.11%), Indian (Asian) ($46,481, a difference of 0.16%), Immigrants from South Central Asia ($46,324, a difference of 0.50%), and Immigrants from Israel ($46,902, a difference of 0.74%).
| Demographics | Rating | Rank | Median Female Earnings |
| Thais | 100.0 /100 | #7 | Exceptional $47,577 |
| Iranians | 100.0 /100 | #8 | Exceptional $47,421 |
| Immigrants | Iran | 100.0 /100 | #9 | Exceptional $47,154 |
| Immigrants | China | 100.0 /100 | #10 | Exceptional $46,972 |
| Okinawans | 100.0 /100 | #11 | Exceptional $46,905 |
| Immigrants | Israel | 100.0 /100 | #12 | Exceptional $46,902 |
| Immigrants | Australia | 100.0 /100 | #13 | Exceptional $46,573 |
| Soviet Union | 100.0 /100 | #14 | Exceptional $46,556 |
| Immigrants | Eastern Asia | 100.0 /100 | #15 | Exceptional $46,502 |
| Indians (Asian) | 100.0 /100 | #16 | Exceptional $46,481 |
| Immigrants | South Central Asia | 100.0 /100 | #17 | Exceptional $46,324 |
| Cypriots | 100.0 /100 | #18 | Exceptional $45,570 |
| Eastern Europeans | 100.0 /100 | #19 | Exceptional $45,385 |
| Immigrants | Japan | 100.0 /100 | #20 | Exceptional $45,323 |
| Cambodians | 100.0 /100 | #21 | Exceptional $45,014 |
Demographics Similar to Fijians by Median Female Earnings
In terms of median female earnings, the demographic groups most similar to Fijians are Bahamian ($35,125, a difference of 0.030%), Sioux ($35,063, a difference of 0.15%), Immigrants from Bahamas ($35,027, a difference of 0.25%), Honduran ($35,013, a difference of 0.29%), and Chippewa ($35,003, a difference of 0.32%).
| Demographics | Rating | Rank | Median Female Earnings |
| Immigrants | Guatemala | 0.0 /100 | #299 | Tragic $35,444 |
| Yuman | 0.0 /100 | #300 | Tragic $35,377 |
| Pima | 0.0 /100 | #301 | Tragic $35,326 |
| Blacks/African Americans | 0.0 /100 | #302 | Tragic $35,315 |
| Immigrants | Latin America | 0.0 /100 | #303 | Tragic $35,307 |
| Crow | 0.0 /100 | #304 | Tragic $35,266 |
| Bahamians | 0.0 /100 | #305 | Tragic $35,125 |
| Fijians | 0.0 /100 | #306 | Tragic $35,114 |
| Sioux | 0.0 /100 | #307 | Tragic $35,063 |
| Immigrants | Bahamas | 0.0 /100 | #308 | Tragic $35,027 |
| Hondurans | 0.0 /100 | #309 | Tragic $35,013 |
| Chippewa | 0.0 /100 | #310 | Tragic $35,003 |
| Ute | 0.0 /100 | #311 | Tragic $34,960 |
| Yaqui | 0.0 /100 | #312 | Tragic $34,943 |
| Cubans | 0.0 /100 | #313 | Tragic $34,942 |