Northern European vs Pueblo Median Household Income
COMPARE
Northern European
Pueblo
Median Household Income
Median Household Income Comparison
Northern Europeans
Pueblo
$90,446
MEDIAN HOUSEHOLD INCOME
96.9/ 100
METRIC RATING
112th/ 347
METRIC RANK
$64,692
MEDIAN HOUSEHOLD INCOME
0.0/ 100
METRIC RATING
340th/ 347
METRIC RANK
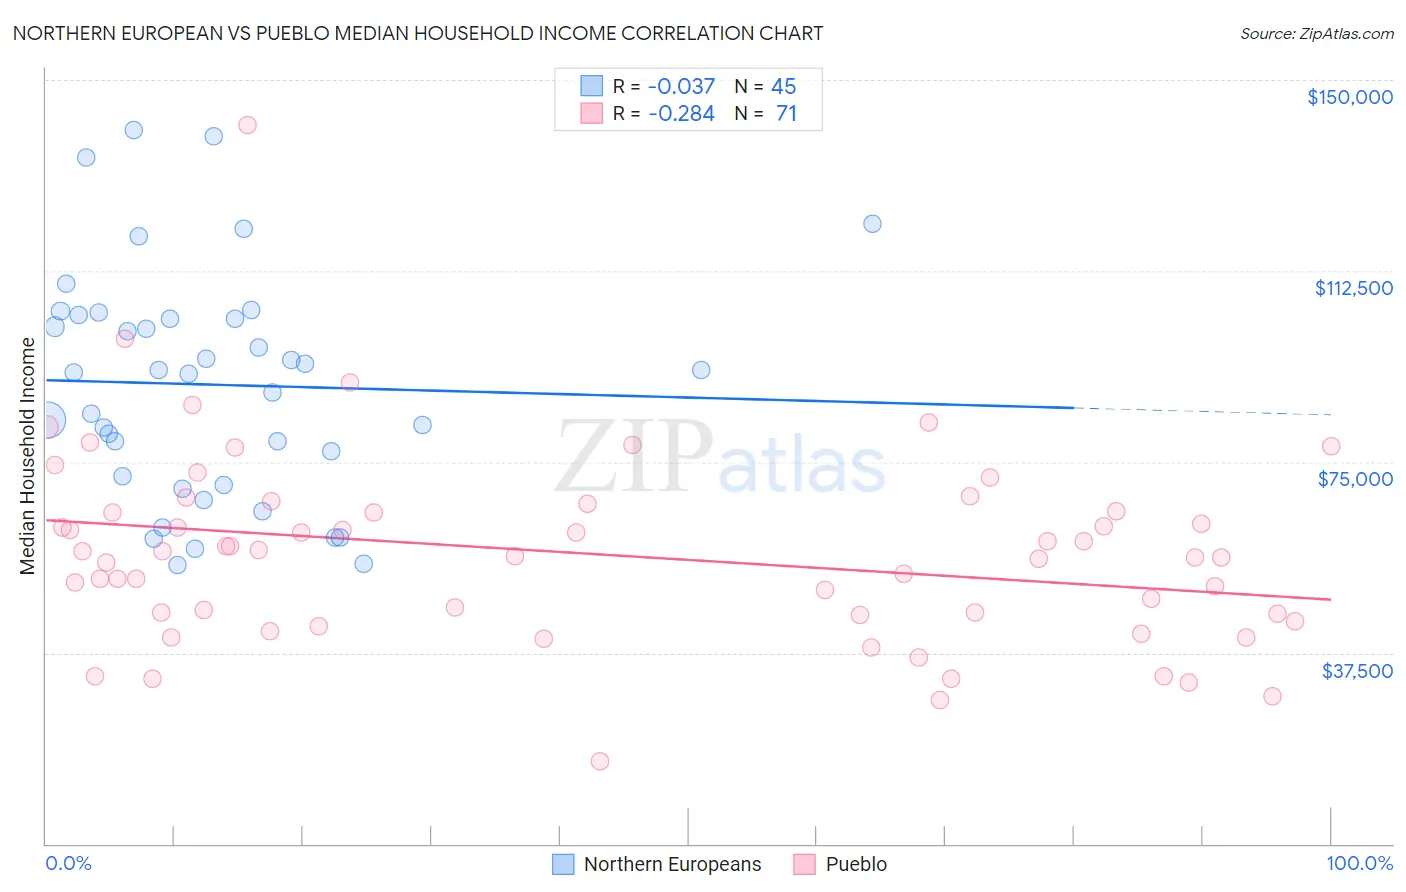
Northern European vs Pueblo Median Household Income Correlation Chart
The statistical analysis conducted on geographies consisting of 405,886,183 people shows no correlation between the proportion of Northern Europeans and median household income in the United States with a correlation coefficient (R) of -0.037 and weighted average of $90,446. Similarly, the statistical analysis conducted on geographies consisting of 120,058,820 people shows a weak negative correlation between the proportion of Pueblo and median household income in the United States with a correlation coefficient (R) of -0.284 and weighted average of $64,692, a difference of 39.8%.
Median Household Income Correlation Summary
| Measurement | Northern European | Pueblo |
| Minimum | $54,809 | $16,250 |
| Maximum | $140,176 | $141,139 |
| Range | $85,367 | $124,889 |
| Mean | $90,148 | $56,992 |
| Median | $92,627 | $56,397 |
| Interquartile 25% (IQ1) | $71,323 | $44,868 |
| Interquartile 75% (IQ3) | $103,516 | $65,216 |
| Interquartile Range (IQR) | $32,192 | $20,348 |
| Standard Deviation (Sample) | $22,235 | $19,041 |
| Standard Deviation (Population) | $21,987 | $18,906 |
Similar Demographics by Median Household Income
Demographics Similar to Northern Europeans by Median Household Income
In terms of median household income, the demographic groups most similar to Northern Europeans are Immigrants from Poland ($90,549, a difference of 0.11%), Palestinian ($90,574, a difference of 0.14%), Chilean ($90,605, a difference of 0.18%), Zimbabwean ($90,618, a difference of 0.19%), and Peruvian ($90,261, a difference of 0.20%).
| Demographics | Rating | Rank | Median Household Income |
| Immigrants | Brazil | 97.7 /100 | #105 | Exceptional $90,907 |
| Macedonians | 97.4 /100 | #106 | Exceptional $90,761 |
| Croatians | 97.3 /100 | #107 | Exceptional $90,685 |
| Zimbabweans | 97.2 /100 | #108 | Exceptional $90,618 |
| Chileans | 97.2 /100 | #109 | Exceptional $90,605 |
| Palestinians | 97.1 /100 | #110 | Exceptional $90,574 |
| Immigrants | Poland | 97.1 /100 | #111 | Exceptional $90,549 |
| Northern Europeans | 96.9 /100 | #112 | Exceptional $90,446 |
| Peruvians | 96.5 /100 | #113 | Exceptional $90,261 |
| Immigrants | Northern Africa | 95.9 /100 | #114 | Exceptional $90,026 |
| Immigrants | Western Asia | 95.9 /100 | #115 | Exceptional $90,005 |
| Native Hawaiians | 95.7 /100 | #116 | Exceptional $89,919 |
| Taiwanese | 95.6 /100 | #117 | Exceptional $89,900 |
| Syrians | 95.4 /100 | #118 | Exceptional $89,830 |
| Albanians | 95.2 /100 | #119 | Exceptional $89,744 |
Demographics Similar to Pueblo by Median Household Income
In terms of median household income, the demographic groups most similar to Pueblo are Hopi ($65,043, a difference of 0.54%), Immigrants from Yemen ($65,194, a difference of 0.78%), Crow ($63,681, a difference of 1.6%), Kiowa ($65,914, a difference of 1.9%), and Pima ($63,262, a difference of 2.3%).
| Demographics | Rating | Rank | Median Household Income |
| Creek | 0.0 /100 | #333 | Tragic $67,715 |
| Blacks/African Americans | 0.0 /100 | #334 | Tragic $67,573 |
| Cheyenne | 0.0 /100 | #335 | Tragic $66,974 |
| Immigrants | Congo | 0.0 /100 | #336 | Tragic $66,768 |
| Kiowa | 0.0 /100 | #337 | Tragic $65,914 |
| Immigrants | Yemen | 0.0 /100 | #338 | Tragic $65,194 |
| Hopi | 0.0 /100 | #339 | Tragic $65,043 |
| Pueblo | 0.0 /100 | #340 | Tragic $64,692 |
| Crow | 0.0 /100 | #341 | Tragic $63,681 |
| Pima | 0.0 /100 | #342 | Tragic $63,262 |
| Houma | 0.0 /100 | #343 | Tragic $62,575 |
| Tohono O'odham | 0.0 /100 | #344 | Tragic $61,663 |
| Puerto Ricans | 0.0 /100 | #345 | Tragic $59,197 |
| Navajo | 0.0 /100 | #346 | Tragic $59,159 |
| Lumbee | 0.0 /100 | #347 | Tragic $54,644 |