Paiute vs Liberian Householder Income Over 65 years
COMPARE
Paiute
Liberian
Householder Income Over 65 years
Householder Income Over 65 years Comparison
Paiute
Liberians
$53,762
HOUSEHOLDER INCOME OVER 65 YEARS
0.1/ 100
METRIC RATING
288th/ 347
METRIC RANK
$54,356
HOUSEHOLDER INCOME OVER 65 YEARS
0.1/ 100
METRIC RATING
271st/ 347
METRIC RANK
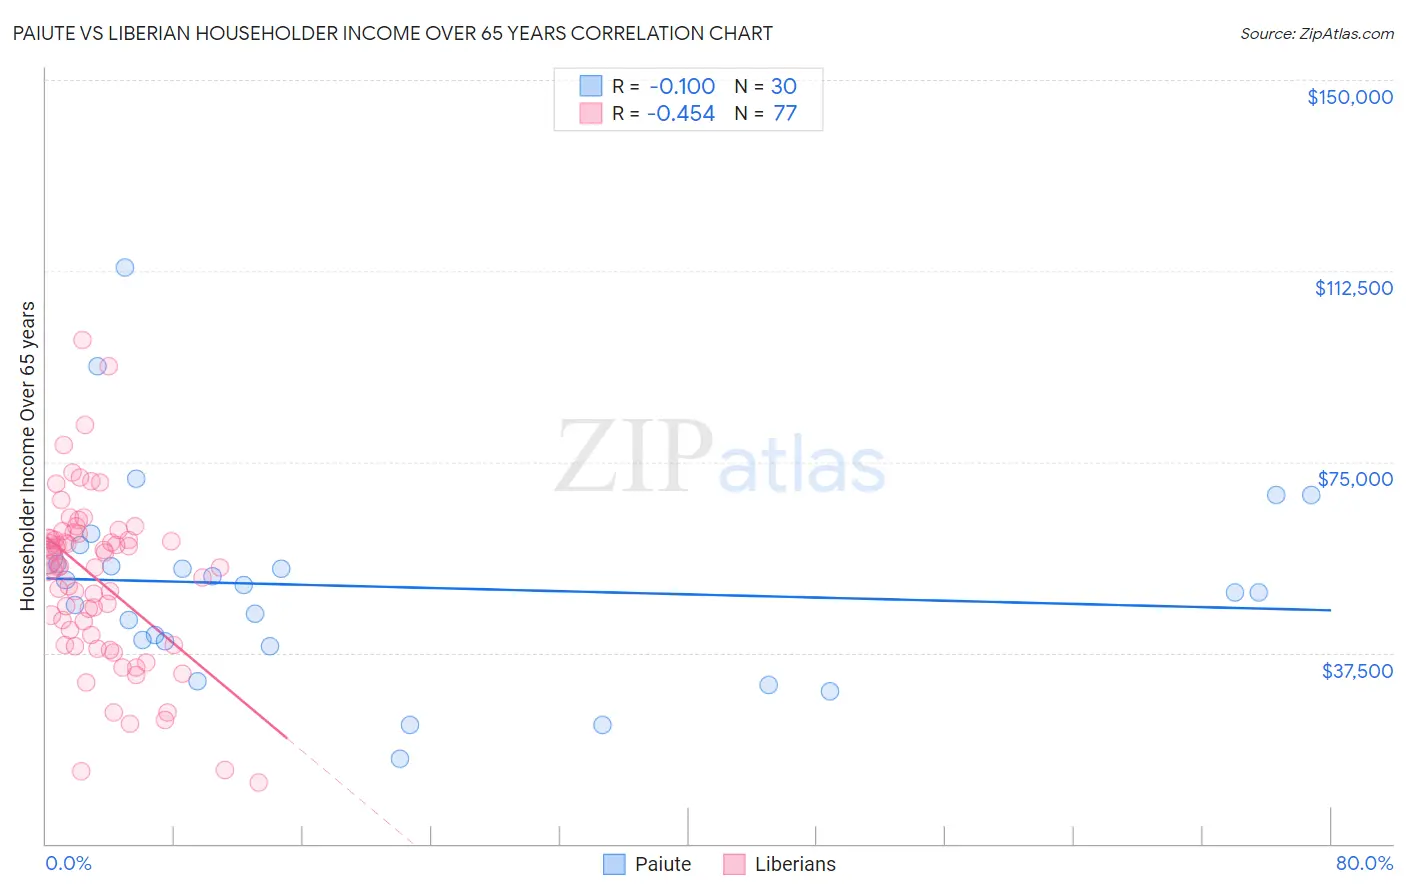
Paiute vs Liberian Householder Income Over 65 years Correlation Chart
The statistical analysis conducted on geographies consisting of 58,330,101 people shows a slight negative correlation between the proportion of Paiute and household income with householder over the age of 65 in the United States with a correlation coefficient (R) of -0.100 and weighted average of $53,762. Similarly, the statistical analysis conducted on geographies consisting of 117,884,771 people shows a moderate negative correlation between the proportion of Liberians and household income with householder over the age of 65 in the United States with a correlation coefficient (R) of -0.454 and weighted average of $54,356, a difference of 1.1%.
Householder Income Over 65 years Correlation Summary
| Measurement | Paiute | Liberian |
| Minimum | $16,667 | $12,021 |
| Maximum | $113,167 | $98,942 |
| Range | $96,500 | $86,921 |
| Mean | $50,506 | $51,904 |
| Median | $50,125 | $54,398 |
| Interquartile 25% (IQ1) | $39,874 | $40,027 |
| Interquartile 75% (IQ3) | $56,261 | $60,409 |
| Interquartile Range (IQR) | $16,387 | $20,383 |
| Standard Deviation (Sample) | $19,872 | $16,445 |
| Standard Deviation (Population) | $19,538 | $16,338 |
Demographics Similar to Paiute and Liberians by Householder Income Over 65 years
In terms of householder income over 65 years, the demographic groups most similar to Paiute are Immigrants from Barbados ($53,766, a difference of 0.010%), Iroquois ($53,737, a difference of 0.050%), Chippewa ($53,847, a difference of 0.16%), Mexican ($53,897, a difference of 0.25%), and Immigrants from Guatemala ($53,950, a difference of 0.35%). Similarly, the demographic groups most similar to Liberians are Immigrants from Senegal ($54,447, a difference of 0.17%), Nicaraguan ($54,474, a difference of 0.22%), Potawatomi ($54,212, a difference of 0.27%), Indonesian ($54,176, a difference of 0.33%), and Barbadian ($54,163, a difference of 0.36%).
| Demographics | Rating | Rank | Householder Income Over 65 years |
| Nicaraguans | 0.1 /100 | #269 | Tragic $54,474 |
| Immigrants | Senegal | 0.1 /100 | #270 | Tragic $54,447 |
| Liberians | 0.1 /100 | #271 | Tragic $54,356 |
| Potawatomi | 0.1 /100 | #272 | Tragic $54,212 |
| Indonesians | 0.1 /100 | #273 | Tragic $54,176 |
| Barbadians | 0.1 /100 | #274 | Tragic $54,163 |
| Cherokee | 0.1 /100 | #275 | Tragic $54,133 |
| Cree | 0.1 /100 | #276 | Tragic $54,129 |
| Cheyenne | 0.1 /100 | #277 | Tragic $54,096 |
| Immigrants | Ecuador | 0.1 /100 | #278 | Tragic $54,030 |
| Blackfeet | 0.1 /100 | #279 | Tragic $54,029 |
| Immigrants | Jamaica | 0.1 /100 | #280 | Tragic $54,027 |
| Somalis | 0.1 /100 | #281 | Tragic $54,004 |
| Immigrants | Armenia | 0.1 /100 | #282 | Tragic $53,974 |
| Immigrants | Liberia | 0.1 /100 | #283 | Tragic $53,967 |
| Immigrants | Guatemala | 0.1 /100 | #284 | Tragic $53,950 |
| Mexicans | 0.1 /100 | #285 | Tragic $53,897 |
| Chippewa | 0.1 /100 | #286 | Tragic $53,847 |
| Immigrants | Barbados | 0.1 /100 | #287 | Tragic $53,766 |
| Paiute | 0.1 /100 | #288 | Tragic $53,762 |
| Iroquois | 0.1 /100 | #289 | Tragic $53,737 |