Immigrants from Bahamas vs Basque Householder Income Under 25 years
COMPARE
Immigrants from Bahamas
Basque
Householder Income Under 25 years
Householder Income Under 25 years Comparison
Immigrants from Bahamas
Basques
$45,793
HOUSEHOLDER INCOME UNDER 25 YEARS
0.0/ 100
METRIC RATING
325th/ 347
METRIC RANK
$51,818
HOUSEHOLDER INCOME UNDER 25 YEARS
28.7/ 100
METRIC RATING
179th/ 347
METRIC RANK
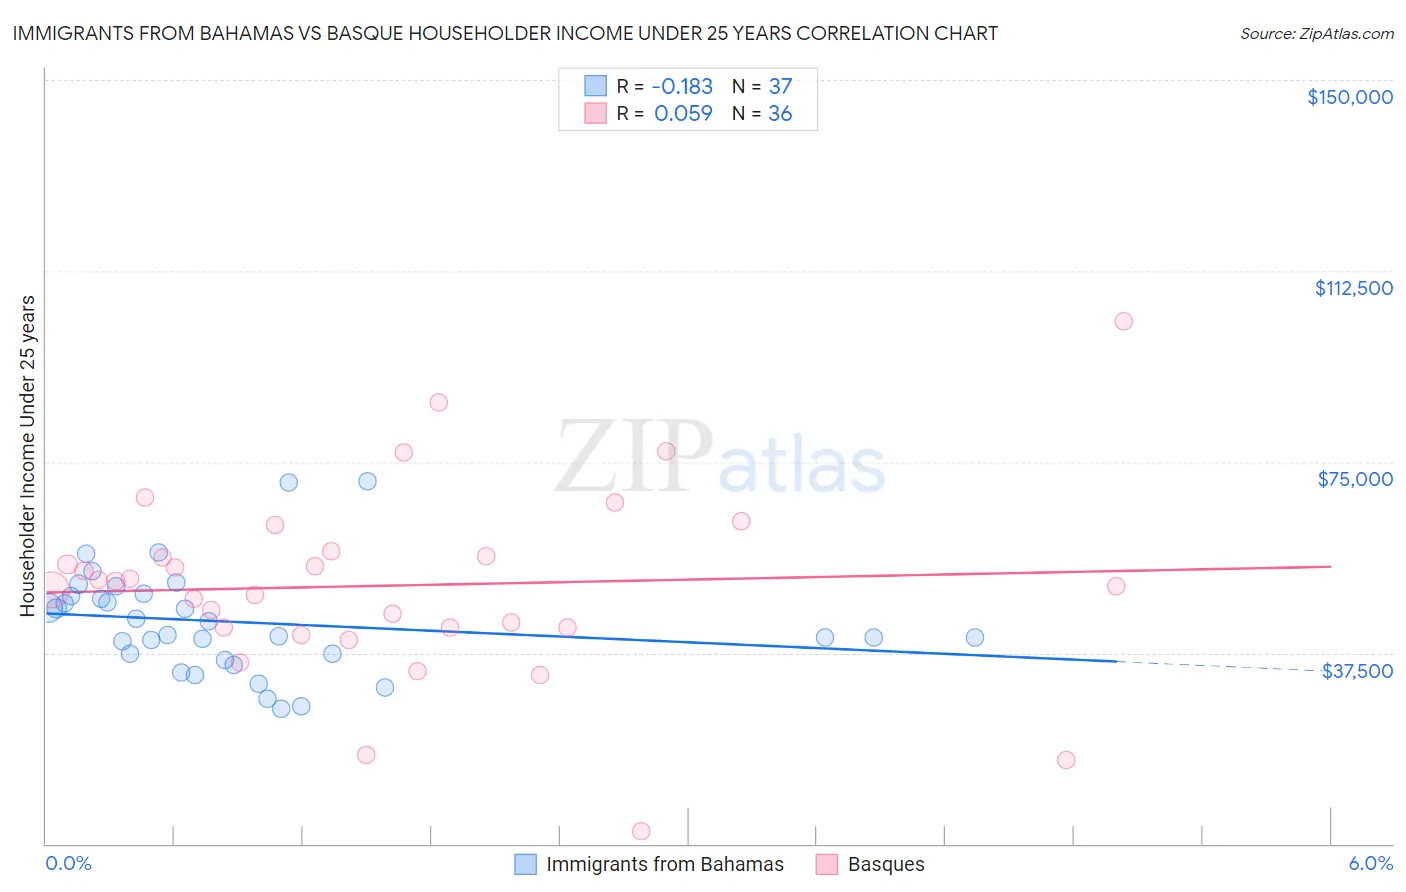
Immigrants from Bahamas vs Basque Householder Income Under 25 years Correlation Chart
The statistical analysis conducted on geographies consisting of 97,494,664 people shows a poor negative correlation between the proportion of Immigrants from Bahamas and household income with householder under the age of 25 in the United States with a correlation coefficient (R) of -0.183 and weighted average of $45,793. Similarly, the statistical analysis conducted on geographies consisting of 150,470,648 people shows a slight positive correlation between the proportion of Basques and household income with householder under the age of 25 in the United States with a correlation coefficient (R) of 0.059 and weighted average of $51,818, a difference of 13.2%.
Householder Income Under 25 years Correlation Summary
| Measurement | Immigrants from Bahamas | Basque |
| Minimum | $26,418 | $2,499 |
| Maximum | $71,250 | $102,571 |
| Range | $44,832 | $100,072 |
| Mean | $43,510 | $50,731 |
| Median | $41,087 | $51,007 |
| Interquartile 25% (IQ1) | $36,692 | $42,540 |
| Interquartile 75% (IQ3) | $48,889 | $57,010 |
| Interquartile Range (IQR) | $12,196 | $14,470 |
| Standard Deviation (Sample) | $10,378 | $18,783 |
| Standard Deviation (Population) | $10,237 | $18,521 |
Similar Demographics by Householder Income Under 25 years
Demographics Similar to Immigrants from Bahamas by Householder Income Under 25 years
In terms of householder income under 25 years, the demographic groups most similar to Immigrants from Bahamas are Dutch West Indian ($45,816, a difference of 0.050%), Osage ($45,764, a difference of 0.060%), Bahamian ($45,743, a difference of 0.11%), German Russian ($45,673, a difference of 0.26%), and Seminole ($45,649, a difference of 0.32%).
| Demographics | Rating | Rank | Householder Income Under 25 years |
| Spanish Americans | 0.0 /100 | #318 | Tragic $46,913 |
| Africans | 0.0 /100 | #319 | Tragic $46,838 |
| Immigrants | Sudan | 0.0 /100 | #320 | Tragic $46,791 |
| Potawatomi | 0.0 /100 | #321 | Tragic $46,462 |
| Sioux | 0.0 /100 | #322 | Tragic $46,417 |
| Immigrants | Saudi Arabia | 0.0 /100 | #323 | Tragic $46,187 |
| Dutch West Indians | 0.0 /100 | #324 | Tragic $45,816 |
| Immigrants | Bahamas | 0.0 /100 | #325 | Tragic $45,793 |
| Osage | 0.0 /100 | #326 | Tragic $45,764 |
| Bahamians | 0.0 /100 | #327 | Tragic $45,743 |
| German Russians | 0.0 /100 | #328 | Tragic $45,673 |
| Seminole | 0.0 /100 | #329 | Tragic $45,649 |
| Indonesians | 0.0 /100 | #330 | Tragic $45,566 |
| Immigrants | Zaire | 0.0 /100 | #331 | Tragic $45,529 |
| Choctaw | 0.0 /100 | #332 | Tragic $45,450 |
Demographics Similar to Basques by Householder Income Under 25 years
In terms of householder income under 25 years, the demographic groups most similar to Basques are Immigrants from England ($51,817, a difference of 0.0%), Finnish ($51,827, a difference of 0.020%), European ($51,796, a difference of 0.040%), Jordanian ($51,796, a difference of 0.040%), and British West Indian ($51,844, a difference of 0.050%).
| Demographics | Rating | Rank | Householder Income Under 25 years |
| Cypriots | 51.2 /100 | #172 | Average $52,209 |
| Barbadians | 50.8 /100 | #173 | Average $52,202 |
| Immigrants | Western Asia | 50.0 /100 | #174 | Average $52,190 |
| Immigrants | Zimbabwe | 33.8 /100 | #175 | Fair $51,914 |
| Austrians | 32.9 /100 | #176 | Fair $51,898 |
| British West Indians | 30.0 /100 | #177 | Fair $51,844 |
| Finns | 29.2 /100 | #178 | Fair $51,827 |
| Basques | 28.7 /100 | #179 | Fair $51,818 |
| Immigrants | England | 28.7 /100 | #180 | Fair $51,817 |
| Europeans | 27.6 /100 | #181 | Fair $51,796 |
| Jordanians | 27.6 /100 | #182 | Fair $51,796 |
| Mexican American Indians | 27.0 /100 | #183 | Fair $51,783 |
| Paiute | 25.1 /100 | #184 | Fair $51,743 |
| Immigrants | Latvia | 24.8 /100 | #185 | Fair $51,737 |
| Alaskan Athabascans | 23.8 /100 | #186 | Fair $51,713 |