Irish vs Eastern European Householder Income Over 65 years
COMPARE
Irish
Eastern European
Householder Income Over 65 years
Householder Income Over 65 years Comparison
Irish
Eastern Europeans
$61,097
HOUSEHOLDER INCOME OVER 65 YEARS
53.4/ 100
METRIC RATING
168th/ 347
METRIC RANK
$70,470
HOUSEHOLDER INCOME OVER 65 YEARS
100.0/ 100
METRIC RATING
18th/ 347
METRIC RANK
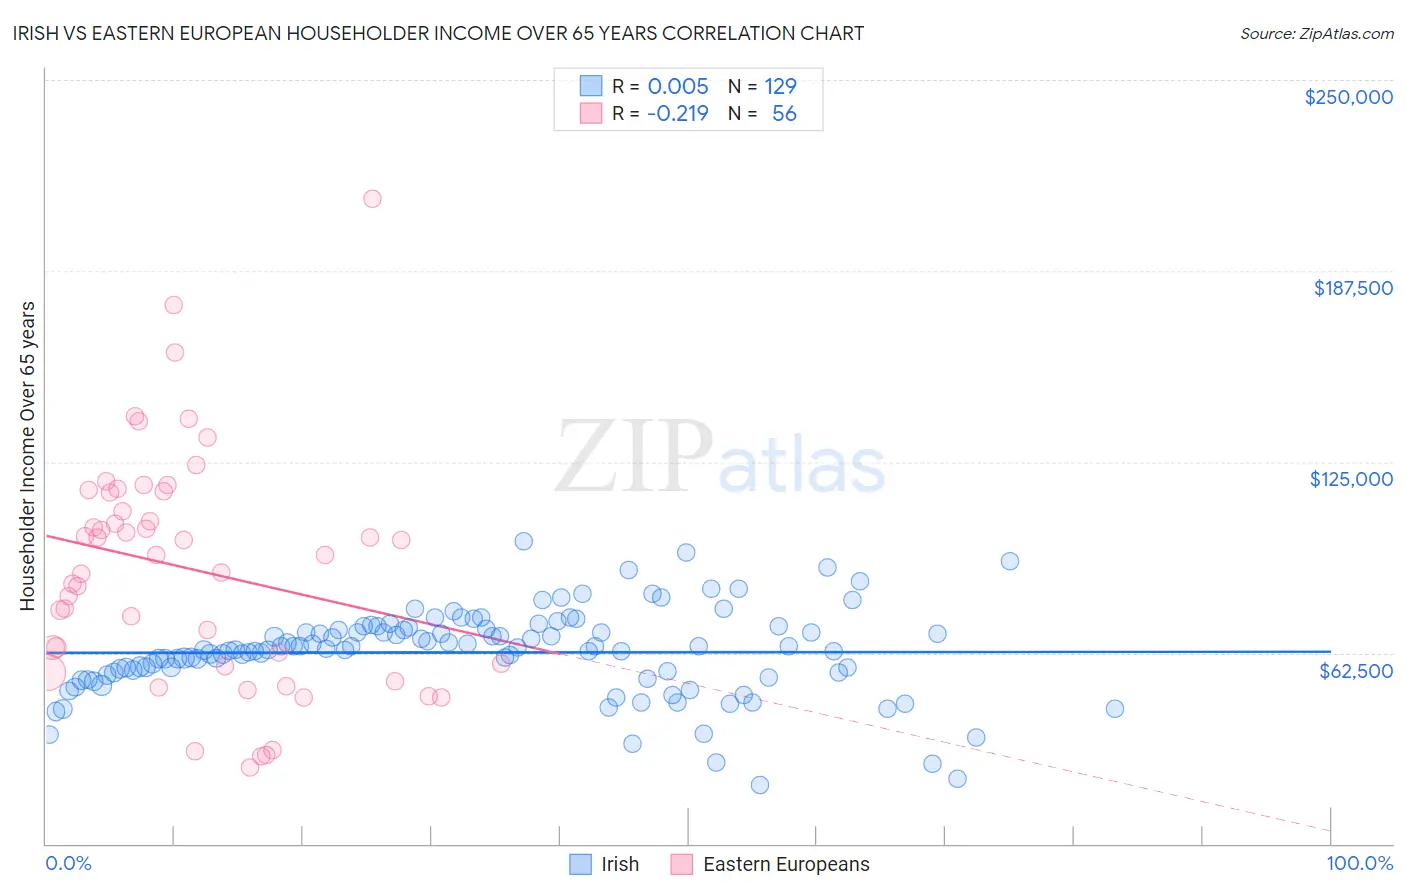
Irish vs Eastern European Householder Income Over 65 years Correlation Chart
The statistical analysis conducted on geographies consisting of 573,728,023 people shows no correlation between the proportion of Irish and household income with householder over the age of 65 in the United States with a correlation coefficient (R) of 0.005 and weighted average of $61,097. Similarly, the statistical analysis conducted on geographies consisting of 459,430,527 people shows a weak negative correlation between the proportion of Eastern Europeans and household income with householder over the age of 65 in the United States with a correlation coefficient (R) of -0.219 and weighted average of $70,470, a difference of 15.3%.
Householder Income Over 65 years Correlation Summary
| Measurement | Irish | Eastern European |
| Minimum | $19,395 | $24,862 |
| Maximum | $98,930 | $211,250 |
| Range | $79,535 | $186,388 |
| Mean | $62,615 | $90,025 |
| Median | $63,596 | $94,688 |
| Interquartile 25% (IQ1) | $56,098 | $58,403 |
| Interquartile 75% (IQ3) | $70,177 | $115,041 |
| Interquartile Range (IQR) | $14,079 | $56,638 |
| Standard Deviation (Sample) | $14,074 | $38,316 |
| Standard Deviation (Population) | $14,019 | $37,972 |
Similar Demographics by Householder Income Over 65 years
Demographics Similar to Irish by Householder Income Over 65 years
In terms of householder income over 65 years, the demographic groups most similar to Irish are Norwegian ($61,104, a difference of 0.010%), Carpatho Rusyn ($61,093, a difference of 0.010%), Serbian ($61,087, a difference of 0.020%), Inupiat ($61,061, a difference of 0.060%), and Immigrants from Poland ($61,041, a difference of 0.090%).
| Demographics | Rating | Rank | Householder Income Over 65 years |
| Icelanders | 57.9 /100 | #161 | Average $61,270 |
| Czechs | 57.2 /100 | #162 | Average $61,244 |
| Ugandans | 55.5 /100 | #163 | Average $61,177 |
| Immigrants | North Macedonia | 55.4 /100 | #164 | Average $61,175 |
| Immigrants | Ukraine | 55.1 /100 | #165 | Average $61,163 |
| Immigrants | Eastern Africa | 55.0 /100 | #166 | Average $61,157 |
| Norwegians | 53.6 /100 | #167 | Average $61,104 |
| Irish | 53.4 /100 | #168 | Average $61,097 |
| Carpatho Rusyns | 53.3 /100 | #169 | Average $61,093 |
| Serbians | 53.1 /100 | #170 | Average $61,087 |
| Inupiat | 52.4 /100 | #171 | Average $61,061 |
| Immigrants | Poland | 51.9 /100 | #172 | Average $61,041 |
| Immigrants | Micronesia | 50.8 /100 | #173 | Average $61,000 |
| Luxembourgers | 50.0 /100 | #174 | Average $60,967 |
| Spaniards | 47.3 /100 | #175 | Average $60,866 |
Demographics Similar to Eastern Europeans by Householder Income Over 65 years
In terms of householder income over 65 years, the demographic groups most similar to Eastern Europeans are Immigrants from Korea ($70,696, a difference of 0.32%), Indian (Asian) ($70,238, a difference of 0.33%), Immigrants from South Central Asia ($70,103, a difference of 0.52%), Okinawan ($70,846, a difference of 0.53%), and Native Hawaiian ($71,021, a difference of 0.78%).
| Demographics | Rating | Rank | Householder Income Over 65 years |
| Thais | 100.0 /100 | #11 | Exceptional $72,099 |
| Cypriots | 100.0 /100 | #12 | Exceptional $71,714 |
| Immigrants | Hong Kong | 100.0 /100 | #13 | Exceptional $71,567 |
| Burmese | 100.0 /100 | #14 | Exceptional $71,139 |
| Native Hawaiians | 100.0 /100 | #15 | Exceptional $71,021 |
| Okinawans | 100.0 /100 | #16 | Exceptional $70,846 |
| Immigrants | Korea | 100.0 /100 | #17 | Exceptional $70,696 |
| Eastern Europeans | 100.0 /100 | #18 | Exceptional $70,470 |
| Indians (Asian) | 100.0 /100 | #19 | Exceptional $70,238 |
| Immigrants | South Central Asia | 100.0 /100 | #20 | Exceptional $70,103 |
| Immigrants | Eastern Asia | 100.0 /100 | #21 | Exceptional $69,872 |
| Immigrants | Israel | 100.0 /100 | #22 | Exceptional $69,857 |
| Immigrants | Japan | 100.0 /100 | #23 | Exceptional $69,774 |
| Immigrants | Sweden | 100.0 /100 | #24 | Exceptional $69,722 |
| Immigrants | Belgium | 100.0 /100 | #25 | Exceptional $69,703 |