Immigrants from Brazil vs American Median Earnings
COMPARE
Immigrants from Brazil
American
Median Earnings
Median Earnings Comparison
Immigrants from Brazil
Americans
$49,463
MEDIAN EARNINGS
98.6/ 100
METRIC RATING
104th/ 347
METRIC RANK
$42,742
MEDIAN EARNINGS
0.6/ 100
METRIC RATING
268th/ 347
METRIC RANK
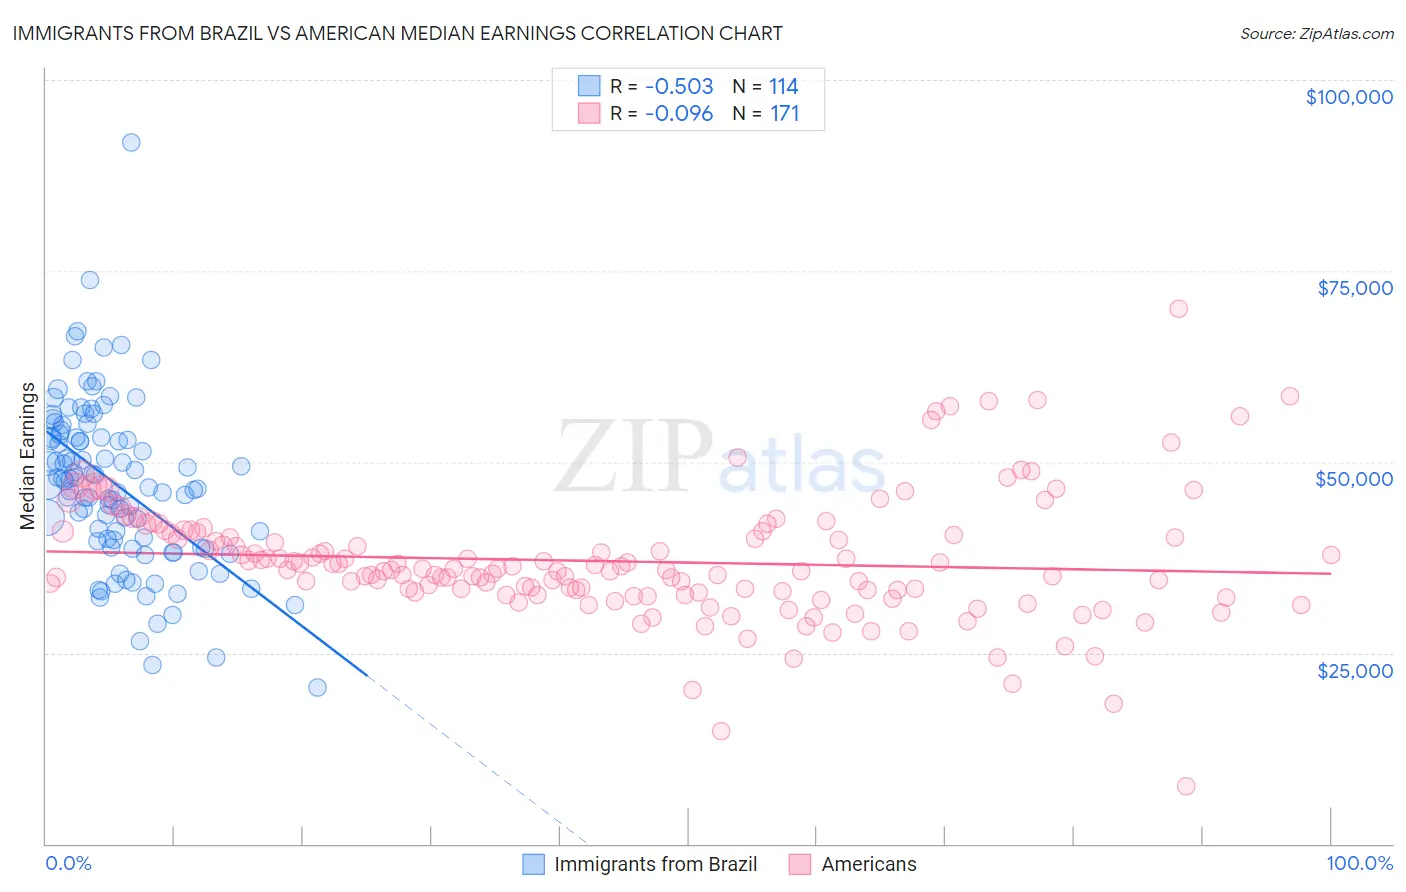
Immigrants from Brazil vs American Median Earnings Correlation Chart
The statistical analysis conducted on geographies consisting of 343,004,043 people shows a substantial negative correlation between the proportion of Immigrants from Brazil and median earnings in the United States with a correlation coefficient (R) of -0.503 and weighted average of $49,463. Similarly, the statistical analysis conducted on geographies consisting of 581,345,964 people shows a slight negative correlation between the proportion of Americans and median earnings in the United States with a correlation coefficient (R) of -0.096 and weighted average of $42,742, a difference of 15.7%.
Median Earnings Correlation Summary
| Measurement | Immigrants from Brazil | American |
| Minimum | $20,417 | $7,598 |
| Maximum | $91,768 | $70,000 |
| Range | $71,351 | $62,402 |
| Mean | $47,008 | $36,993 |
| Median | $47,178 | $35,919 |
| Interquartile 25% (IQ1) | $39,617 | $32,980 |
| Interquartile 75% (IQ3) | $53,219 | $40,815 |
| Interquartile Range (IQR) | $13,601 | $7,835 |
| Standard Deviation (Sample) | $10,976 | $8,064 |
| Standard Deviation (Population) | $10,928 | $8,040 |
Similar Demographics by Median Earnings
Demographics Similar to Immigrants from Brazil by Median Earnings
In terms of median earnings, the demographic groups most similar to Immigrants from Brazil are Austrian ($49,501, a difference of 0.080%), Immigrants from Western Asia ($49,389, a difference of 0.15%), Immigrants from Albania ($49,377, a difference of 0.17%), Immigrants from Morocco ($49,368, a difference of 0.19%), and Ethiopian ($49,572, a difference of 0.22%).
| Demographics | Rating | Rank | Median Earnings |
| Immigrants | North Macedonia | 98.9 /100 | #97 | Exceptional $49,658 |
| Immigrants | Northern Africa | 98.9 /100 | #98 | Exceptional $49,648 |
| Immigrants | Afghanistan | 98.9 /100 | #99 | Exceptional $49,645 |
| Immigrants | Poland | 98.9 /100 | #100 | Exceptional $49,633 |
| Jordanians | 98.9 /100 | #101 | Exceptional $49,632 |
| Ethiopians | 98.8 /100 | #102 | Exceptional $49,572 |
| Austrians | 98.7 /100 | #103 | Exceptional $49,501 |
| Immigrants | Brazil | 98.6 /100 | #104 | Exceptional $49,463 |
| Immigrants | Western Asia | 98.4 /100 | #105 | Exceptional $49,389 |
| Immigrants | Albania | 98.4 /100 | #106 | Exceptional $49,377 |
| Immigrants | Morocco | 98.4 /100 | #107 | Exceptional $49,368 |
| Palestinians | 98.0 /100 | #108 | Exceptional $49,209 |
| Syrians | 97.1 /100 | #109 | Exceptional $48,934 |
| Immigrants | Ethiopia | 97.1 /100 | #110 | Exceptional $48,924 |
| Immigrants | Zimbabwe | 97.0 /100 | #111 | Exceptional $48,913 |
Demographics Similar to Americans by Median Earnings
In terms of median earnings, the demographic groups most similar to Americans are Cree ($42,777, a difference of 0.080%), Belizean ($42,702, a difference of 0.090%), Osage ($42,651, a difference of 0.21%), Pennsylvania German ($42,615, a difference of 0.30%), and Immigrants from Laos ($42,884, a difference of 0.33%).
| Demographics | Rating | Rank | Median Earnings |
| Immigrants | Jamaica | 0.8 /100 | #261 | Tragic $43,026 |
| Nicaraguans | 0.8 /100 | #262 | Tragic $43,026 |
| Inupiat | 0.8 /100 | #263 | Tragic $43,000 |
| Immigrants | Liberia | 0.7 /100 | #264 | Tragic $42,923 |
| Salvadorans | 0.7 /100 | #265 | Tragic $42,912 |
| Immigrants | Laos | 0.7 /100 | #266 | Tragic $42,884 |
| Cree | 0.6 /100 | #267 | Tragic $42,777 |
| Americans | 0.6 /100 | #268 | Tragic $42,742 |
| Belizeans | 0.5 /100 | #269 | Tragic $42,702 |
| Osage | 0.5 /100 | #270 | Tragic $42,651 |
| Pennsylvania Germans | 0.5 /100 | #271 | Tragic $42,615 |
| Iroquois | 0.4 /100 | #272 | Tragic $42,430 |
| Immigrants | Dominica | 0.4 /100 | #273 | Tragic $42,420 |
| Immigrants | El Salvador | 0.4 /100 | #274 | Tragic $42,413 |
| Immigrants | Belize | 0.3 /100 | #275 | Tragic $42,339 |