Immigrants from Egypt vs Sioux Householder Income Ages 25 - 44 years
COMPARE
Immigrants from Egypt
Sioux
Householder Income Ages 25 - 44 years
Householder Income Ages 25 - 44 years Comparison
Immigrants from Egypt
Sioux
$103,192
HOUSEHOLDER INCOME AGES 25 - 44 YEARS
99.2/ 100
METRIC RATING
80th/ 347
METRIC RANK
$77,089
HOUSEHOLDER INCOME AGES 25 - 44 YEARS
0.0/ 100
METRIC RATING
325th/ 347
METRIC RANK
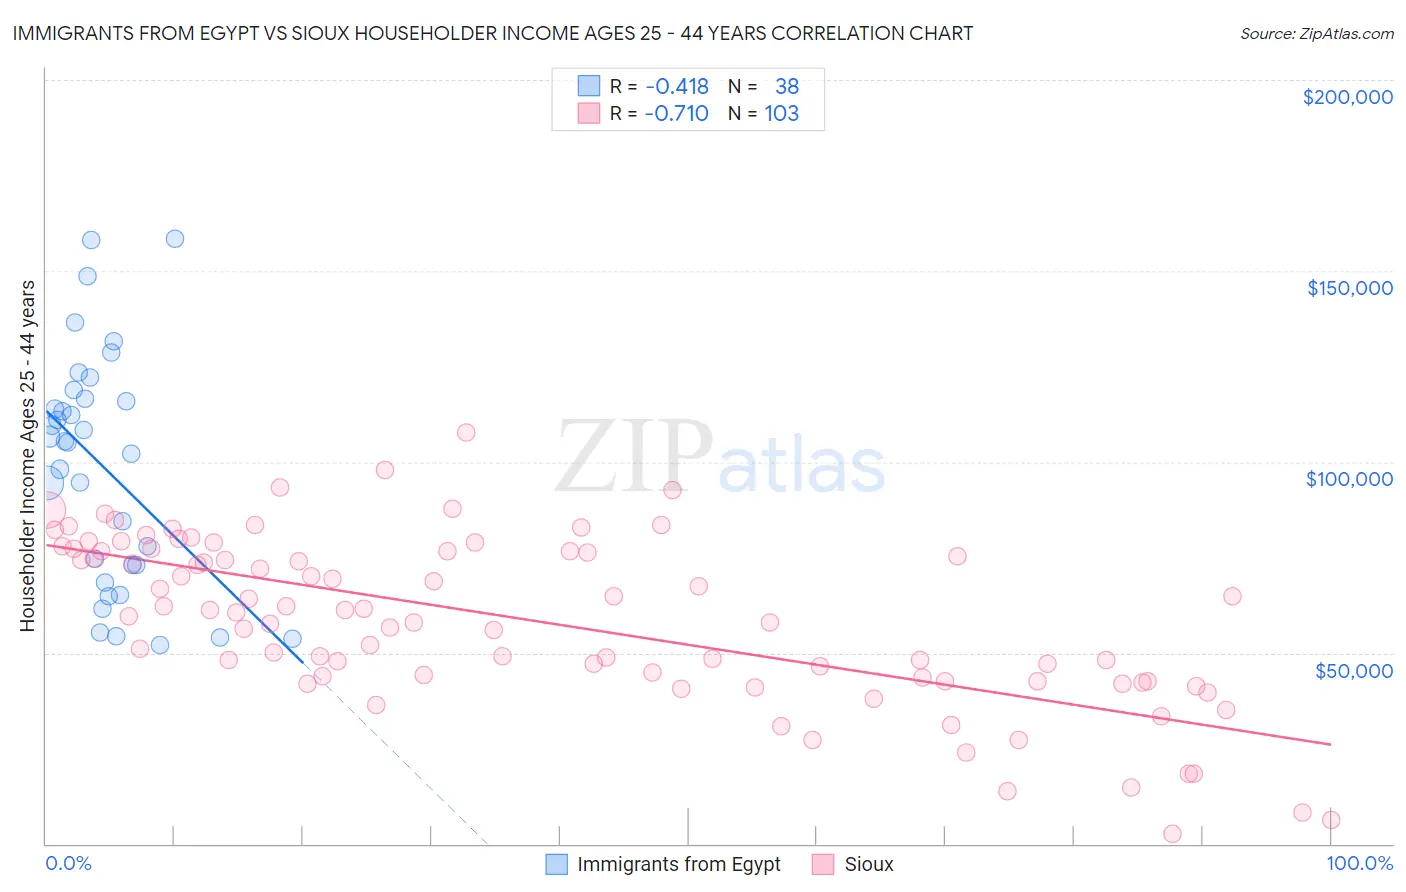
Immigrants from Egypt vs Sioux Householder Income Ages 25 - 44 years Correlation Chart
The statistical analysis conducted on geographies consisting of 245,137,860 people shows a moderate negative correlation between the proportion of Immigrants from Egypt and household income with householder between the ages 25 and 44 in the United States with a correlation coefficient (R) of -0.418 and weighted average of $103,192. Similarly, the statistical analysis conducted on geographies consisting of 233,739,759 people shows a strong negative correlation between the proportion of Sioux and household income with householder between the ages 25 and 44 in the United States with a correlation coefficient (R) of -0.710 and weighted average of $77,089, a difference of 33.9%.
Householder Income Ages 25 - 44 years Correlation Summary
| Measurement | Immigrants from Egypt | Sioux |
| Minimum | $52,083 | $2,499 |
| Maximum | $158,487 | $107,750 |
| Range | $106,404 | $105,251 |
| Mean | $98,589 | $58,364 |
| Median | $105,246 | $60,620 |
| Interquartile 25% (IQ1) | $73,125 | $42,554 |
| Interquartile 75% (IQ3) | $116,638 | $76,563 |
| Interquartile Range (IQR) | $43,513 | $34,009 |
| Standard Deviation (Sample) | $30,067 | $21,906 |
| Standard Deviation (Population) | $29,669 | $21,799 |
Similar Demographics by Householder Income Ages 25 - 44 years
Demographics Similar to Immigrants from Egypt by Householder Income Ages 25 - 44 years
In terms of householder income ages 25 - 44 years, the demographic groups most similar to Immigrants from Egypt are South African ($103,160, a difference of 0.030%), Immigrants from Serbia ($103,155, a difference of 0.040%), Armenian ($103,248, a difference of 0.050%), Argentinean ($103,111, a difference of 0.080%), and Immigrants from Bulgaria ($103,423, a difference of 0.22%).
| Demographics | Rating | Rank | Householder Income Ages 25 - 44 years |
| Italians | 99.5 /100 | #73 | Exceptional $104,215 |
| Immigrants | Fiji | 99.5 /100 | #74 | Exceptional $103,954 |
| Koreans | 99.4 /100 | #75 | Exceptional $103,824 |
| Immigrants | Spain | 99.4 /100 | #76 | Exceptional $103,752 |
| Immigrants | Southern Europe | 99.3 /100 | #77 | Exceptional $103,486 |
| Immigrants | Bulgaria | 99.3 /100 | #78 | Exceptional $103,423 |
| Armenians | 99.2 /100 | #79 | Exceptional $103,248 |
| Immigrants | Egypt | 99.2 /100 | #80 | Exceptional $103,192 |
| South Africans | 99.2 /100 | #81 | Exceptional $103,160 |
| Immigrants | Serbia | 99.2 /100 | #82 | Exceptional $103,155 |
| Argentineans | 99.1 /100 | #83 | Exceptional $103,111 |
| Immigrants | Philippines | 99.0 /100 | #84 | Exceptional $102,910 |
| Immigrants | Ukraine | 98.9 /100 | #85 | Exceptional $102,664 |
| Immigrants | Hungary | 98.9 /100 | #86 | Exceptional $102,655 |
| Immigrants | Western Europe | 98.9 /100 | #87 | Exceptional $102,654 |
Demographics Similar to Sioux by Householder Income Ages 25 - 44 years
In terms of householder income ages 25 - 44 years, the demographic groups most similar to Sioux are Houma ($77,044, a difference of 0.060%), Dutch West Indian ($77,260, a difference of 0.22%), Immigrants from Bahamas ($76,910, a difference of 0.23%), Immigrants from Honduras ($77,328, a difference of 0.31%), and Immigrants from Cuba ($76,701, a difference of 0.51%).
| Demographics | Rating | Rank | Householder Income Ages 25 - 44 years |
| Immigrants | Mexico | 0.0 /100 | #318 | Tragic $78,809 |
| Hondurans | 0.0 /100 | #319 | Tragic $78,540 |
| Choctaw | 0.0 /100 | #320 | Tragic $78,168 |
| Immigrants | Zaire | 0.0 /100 | #321 | Tragic $78,045 |
| Chickasaw | 0.0 /100 | #322 | Tragic $77,929 |
| Immigrants | Honduras | 0.0 /100 | #323 | Tragic $77,328 |
| Dutch West Indians | 0.0 /100 | #324 | Tragic $77,260 |
| Sioux | 0.0 /100 | #325 | Tragic $77,089 |
| Houma | 0.0 /100 | #326 | Tragic $77,044 |
| Immigrants | Bahamas | 0.0 /100 | #327 | Tragic $76,910 |
| Immigrants | Cuba | 0.0 /100 | #328 | Tragic $76,701 |
| Seminole | 0.0 /100 | #329 | Tragic $76,584 |
| Yakama | 0.0 /100 | #330 | Tragic $76,226 |
| Natives/Alaskans | 0.0 /100 | #331 | Tragic $75,647 |
| Bahamians | 0.0 /100 | #332 | Tragic $75,395 |