Sioux vs Immigrants from South America Median Family Income
COMPARE
Sioux
Immigrants from South America
Median Family Income
Median Family Income Comparison
Sioux
Immigrants from South America
$82,386
MEDIAN FAMILY INCOME
0.0/ 100
METRIC RATING
325th/ 347
METRIC RANK
$100,414
MEDIAN FAMILY INCOME
23.9/ 100
METRIC RATING
195th/ 347
METRIC RANK
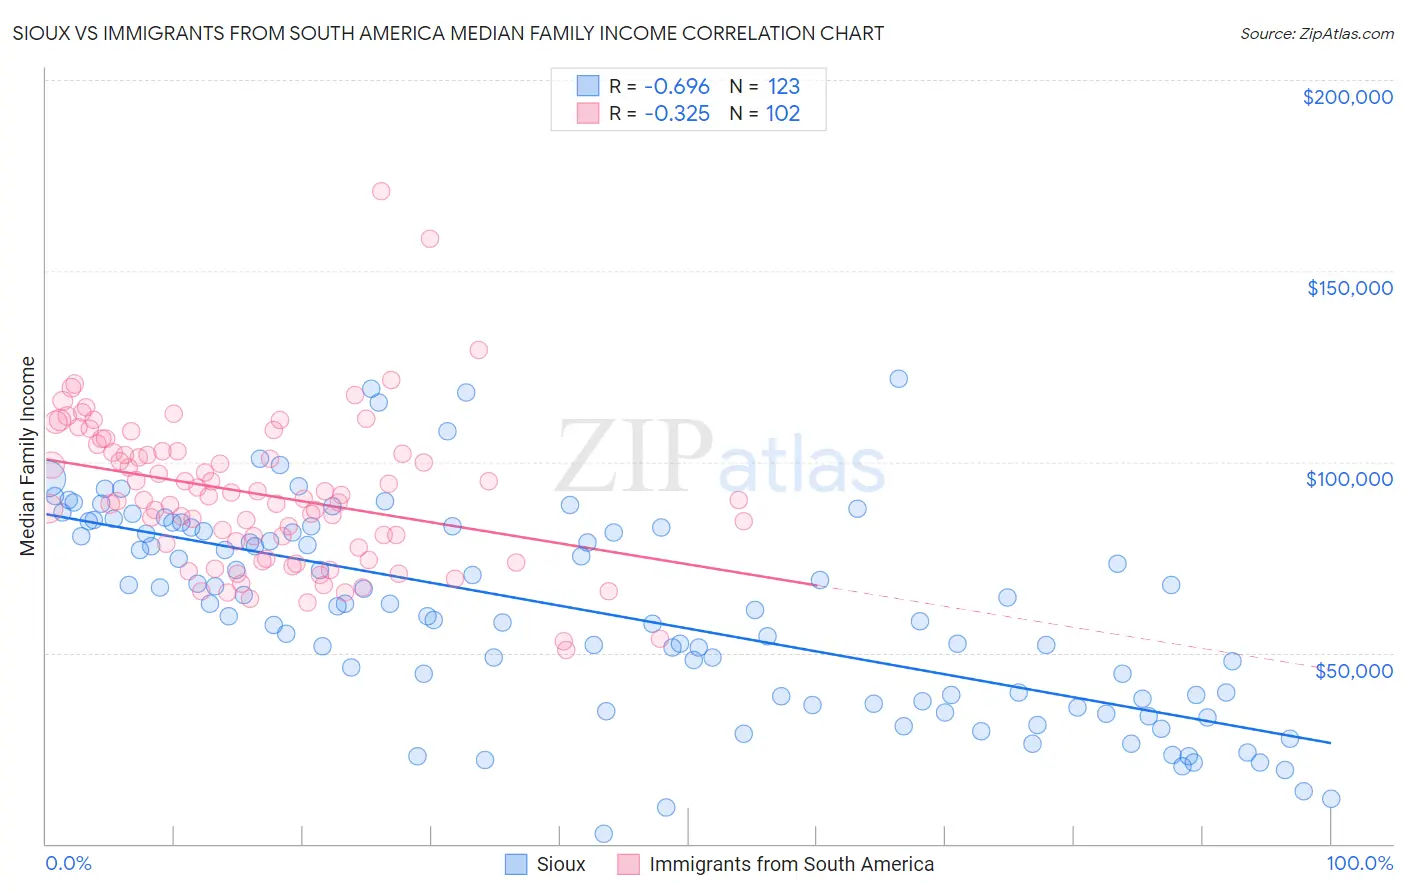
Sioux vs Immigrants from South America Median Family Income Correlation Chart
The statistical analysis conducted on geographies consisting of 234,054,236 people shows a significant negative correlation between the proportion of Sioux and median family income in the United States with a correlation coefficient (R) of -0.696 and weighted average of $82,386. Similarly, the statistical analysis conducted on geographies consisting of 485,794,963 people shows a mild negative correlation between the proportion of Immigrants from South America and median family income in the United States with a correlation coefficient (R) of -0.325 and weighted average of $100,414, a difference of 21.9%.
Median Family Income Correlation Summary
| Measurement | Sioux | Immigrants from South America |
| Minimum | $2,499 | $50,833 |
| Maximum | $121,875 | $170,845 |
| Range | $119,376 | $120,012 |
| Mean | $60,906 | $91,529 |
| Median | $62,832 | $90,163 |
| Interquartile 25% (IQ1) | $37,821 | $77,453 |
| Interquartile 75% (IQ3) | $82,841 | $102,677 |
| Interquartile Range (IQR) | $45,020 | $25,224 |
| Standard Deviation (Sample) | $26,471 | $19,800 |
| Standard Deviation (Population) | $26,363 | $19,702 |
Similar Demographics by Median Family Income
Demographics Similar to Sioux by Median Family Income
In terms of median family income, the demographic groups most similar to Sioux are Creek ($82,560, a difference of 0.21%), Immigrants from Congo ($82,216, a difference of 0.21%), Bahamian ($82,631, a difference of 0.30%), Arapaho ($82,064, a difference of 0.39%), and Black/African American ($81,912, a difference of 0.58%).
| Demographics | Rating | Rank | Median Family Income |
| Immigrants | Mexico | 0.0 /100 | #318 | Tragic $83,639 |
| Immigrants | Honduras | 0.0 /100 | #319 | Tragic $83,618 |
| Seminole | 0.0 /100 | #320 | Tragic $83,354 |
| Immigrants | Caribbean | 0.0 /100 | #321 | Tragic $83,319 |
| Dominicans | 0.0 /100 | #322 | Tragic $82,888 |
| Bahamians | 0.0 /100 | #323 | Tragic $82,631 |
| Creek | 0.0 /100 | #324 | Tragic $82,560 |
| Sioux | 0.0 /100 | #325 | Tragic $82,386 |
| Immigrants | Congo | 0.0 /100 | #326 | Tragic $82,216 |
| Arapaho | 0.0 /100 | #327 | Tragic $82,064 |
| Blacks/African Americans | 0.0 /100 | #328 | Tragic $81,912 |
| Dutch West Indians | 0.0 /100 | #329 | Tragic $81,852 |
| Cheyenne | 0.0 /100 | #330 | Tragic $81,385 |
| Immigrants | Dominican Republic | 0.0 /100 | #331 | Tragic $81,233 |
| Natives/Alaskans | 0.0 /100 | #332 | Tragic $80,908 |
Demographics Similar to Immigrants from South America by Median Family Income
In terms of median family income, the demographic groups most similar to Immigrants from South America are Samoan ($100,344, a difference of 0.070%), Immigrants from Cameroon ($100,289, a difference of 0.12%), Immigrants from Africa ($100,256, a difference of 0.16%), Iraqi ($100,658, a difference of 0.24%), and Uruguayan ($100,656, a difference of 0.24%).
| Demographics | Rating | Rank | Median Family Income |
| Guamanians/Chamorros | 30.5 /100 | #188 | Fair $101,061 |
| Immigrants | Portugal | 29.6 /100 | #189 | Fair $100,984 |
| Immigrants | Immigrants | 29.4 /100 | #190 | Fair $100,962 |
| Colombians | 27.2 /100 | #191 | Fair $100,750 |
| Immigrants | Kenya | 26.5 /100 | #192 | Fair $100,679 |
| Iraqis | 26.3 /100 | #193 | Fair $100,658 |
| Uruguayans | 26.3 /100 | #194 | Fair $100,656 |
| Immigrants | South America | 23.9 /100 | #195 | Fair $100,414 |
| Samoans | 23.3 /100 | #196 | Fair $100,344 |
| Immigrants | Cameroon | 22.8 /100 | #197 | Fair $100,289 |
| Immigrants | Africa | 22.5 /100 | #198 | Fair $100,256 |
| Yugoslavians | 21.3 /100 | #199 | Fair $100,119 |
| Spanish | 20.1 /100 | #200 | Fair $99,977 |
| Immigrants | Thailand | 19.0 /100 | #201 | Poor $99,840 |
| Whites/Caucasians | 18.7 /100 | #202 | Poor $99,800 |