Inupiat vs Immigrants from Austria Unemployment Among Ages 65 to 74 years
COMPARE
Inupiat
Immigrants from Austria
Unemployment Among Ages 65 to 74 years
Unemployment Among Ages 65 to 74 years Comparison
Inupiat
Immigrants from Austria
7.5%
UNEMPLOYMENT AMONG AGES 65 TO 74 YEARS
0.0/ 100
METRIC RATING
344th/ 347
METRIC RANK
5.1%
UNEMPLOYMENT AMONG AGES 65 TO 74 YEARS
99.8/ 100
METRIC RATING
49th/ 347
METRIC RANK
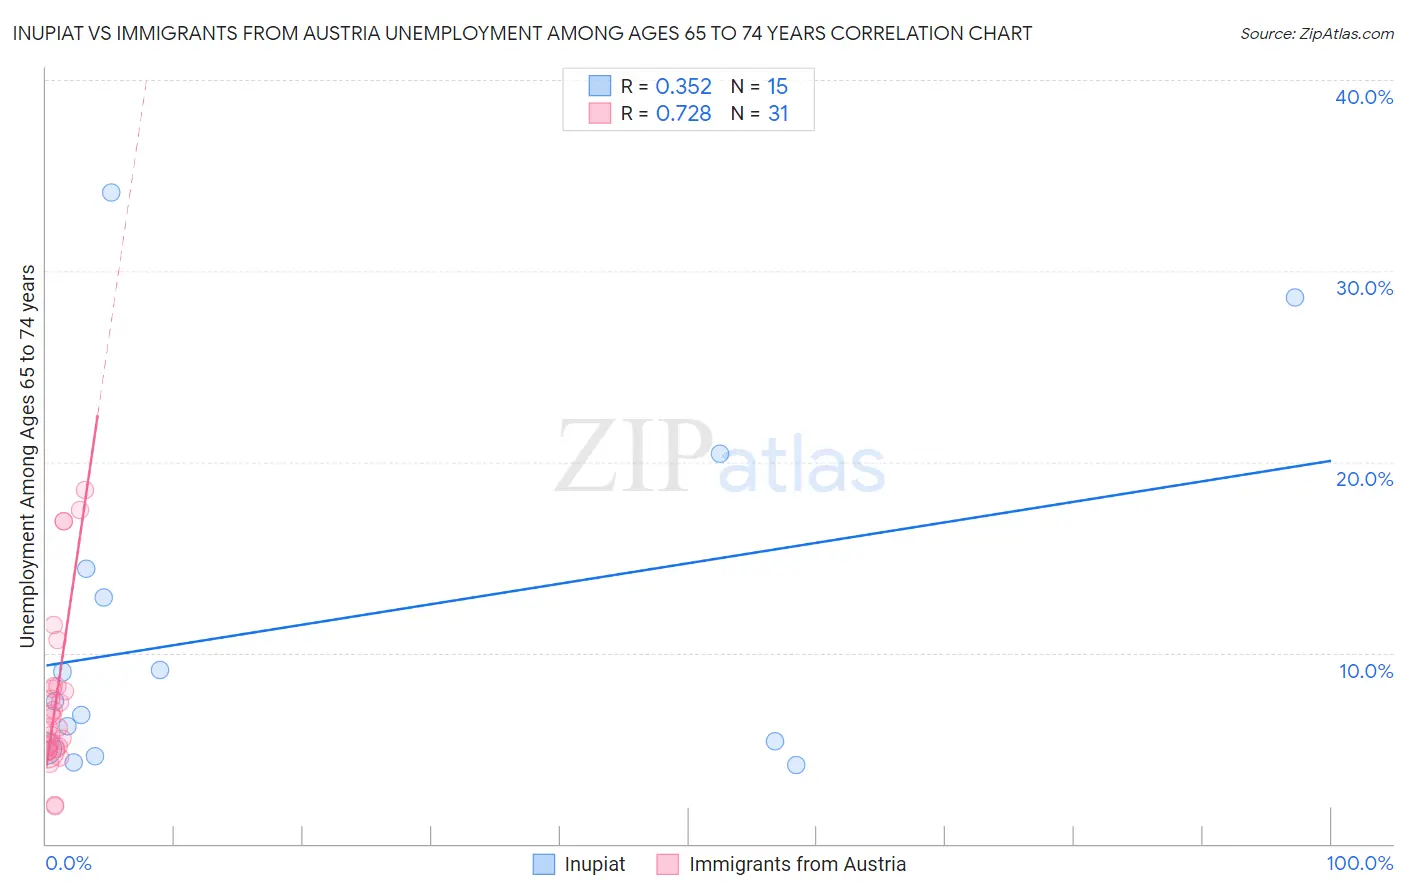
Inupiat vs Immigrants from Austria Unemployment Among Ages 65 to 74 years Correlation Chart
The statistical analysis conducted on geographies consisting of 91,705,326 people shows a mild positive correlation between the proportion of Inupiat and unemployment rate among population between the ages 65 and 74 in the United States with a correlation coefficient (R) of 0.352 and weighted average of 7.5%. Similarly, the statistical analysis conducted on geographies consisting of 158,673,516 people shows a strong positive correlation between the proportion of Immigrants from Austria and unemployment rate among population between the ages 65 and 74 in the United States with a correlation coefficient (R) of 0.728 and weighted average of 5.1%, a difference of 47.0%.
Unemployment Among Ages 65 to 74 years Correlation Summary
| Measurement | Inupiat | Immigrants from Austria |
| Minimum | 4.1% | 2.0% |
| Maximum | 34.1% | 18.5% |
| Range | 30.0% | 16.5% |
| Mean | 11.5% | 7.6% |
| Median | 7.5% | 6.1% |
| Interquartile 25% (IQ1) | 5.0% | 4.9% |
| Interquartile 75% (IQ3) | 14.4% | 8.2% |
| Interquartile Range (IQR) | 9.4% | 3.3% |
| Standard Deviation (Sample) | 9.3% | 4.4% |
| Standard Deviation (Population) | 9.0% | 4.3% |
Similar Demographics by Unemployment Among Ages 65 to 74 years
Demographics Similar to Inupiat by Unemployment Among Ages 65 to 74 years
In terms of unemployment among ages 65 to 74 years, the demographic groups most similar to Inupiat are Alaskan Athabascan (7.4%, a difference of 1.9%), Navajo (6.9%, a difference of 8.2%), Alaska Native (6.8%, a difference of 9.8%), Immigrants from Yemen (8.3%, a difference of 10.2%), and Pima (6.6%, a difference of 13.3%).
| Demographics | Rating | Rank | Unemployment Among Ages 65 to 74 years |
| Paiute | 0.0 /100 | #333 | Tragic 6.3% |
| Taiwanese | 0.0 /100 | #334 | Tragic 6.3% |
| Puerto Ricans | 0.0 /100 | #335 | Tragic 6.4% |
| Immigrants | Armenia | 0.0 /100 | #336 | Tragic 6.5% |
| Ute | 0.0 /100 | #337 | Tragic 6.5% |
| Tlingit-Haida | 0.0 /100 | #338 | Tragic 6.5% |
| Yakama | 0.0 /100 | #339 | Tragic 6.6% |
| Pima | 0.0 /100 | #340 | Tragic 6.6% |
| Alaska Natives | 0.0 /100 | #341 | Tragic 6.8% |
| Navajo | 0.0 /100 | #342 | Tragic 6.9% |
| Alaskan Athabascans | 0.0 /100 | #343 | Tragic 7.4% |
| Inupiat | 0.0 /100 | #344 | Tragic 7.5% |
| Immigrants | Yemen | 0.0 /100 | #345 | Tragic 8.3% |
| Yup'ik | 0.0 /100 | #346 | Tragic 9.5% |
| Crow | 0.0 /100 | #347 | Tragic 17.4% |
Demographics Similar to Immigrants from Austria by Unemployment Among Ages 65 to 74 years
In terms of unemployment among ages 65 to 74 years, the demographic groups most similar to Immigrants from Austria are Choctaw (5.1%, a difference of 0.010%), Immigrants from Zimbabwe (5.1%, a difference of 0.16%), Immigrants from Uganda (5.1%, a difference of 0.18%), Immigrants from Kazakhstan (5.1%, a difference of 0.19%), and Immigrants from Kenya (5.1%, a difference of 0.22%).
| Demographics | Rating | Rank | Unemployment Among Ages 65 to 74 years |
| Jordanians | 99.9 /100 | #42 | Exceptional 5.1% |
| Assyrians/Chaldeans/Syriacs | 99.9 /100 | #43 | Exceptional 5.1% |
| Immigrants | India | 99.9 /100 | #44 | Exceptional 5.1% |
| Sioux | 99.8 /100 | #45 | Exceptional 5.1% |
| Immigrants | Kenya | 99.8 /100 | #46 | Exceptional 5.1% |
| Immigrants | Uganda | 99.8 /100 | #47 | Exceptional 5.1% |
| Choctaw | 99.8 /100 | #48 | Exceptional 5.1% |
| Immigrants | Austria | 99.8 /100 | #49 | Exceptional 5.1% |
| Immigrants | Zimbabwe | 99.7 /100 | #50 | Exceptional 5.1% |
| Immigrants | Kazakhstan | 99.7 /100 | #51 | Exceptional 5.1% |
| Europeans | 99.6 /100 | #52 | Exceptional 5.1% |
| Immigrants | Ethiopia | 99.6 /100 | #53 | Exceptional 5.1% |
| Immigrants | Nicaragua | 99.6 /100 | #54 | Exceptional 5.1% |
| Carpatho Rusyns | 99.6 /100 | #55 | Exceptional 5.1% |
| Swedes | 99.5 /100 | #56 | Exceptional 5.1% |