African vs Yakama Householder Income Ages 25 - 44 years
COMPARE
African
Yakama
Householder Income Ages 25 - 44 years
Householder Income Ages 25 - 44 years Comparison
Africans
Yakama
$78,986
HOUSEHOLDER INCOME AGES 25 - 44 YEARS
0.0/ 100
METRIC RATING
316th/ 347
METRIC RANK
$76,226
HOUSEHOLDER INCOME AGES 25 - 44 YEARS
0.0/ 100
METRIC RATING
330th/ 347
METRIC RANK
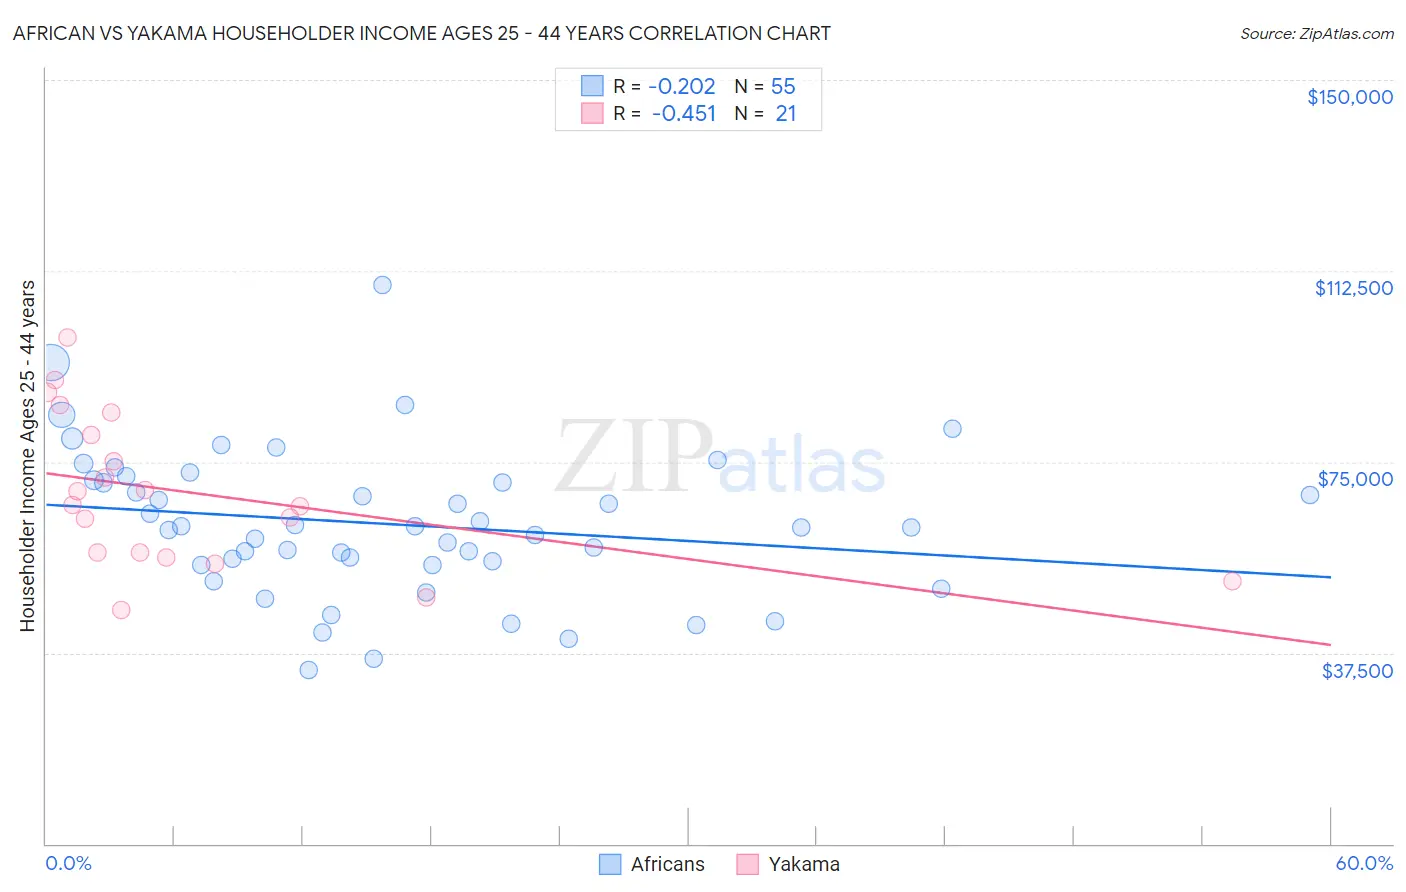
African vs Yakama Householder Income Ages 25 - 44 years Correlation Chart
The statistical analysis conducted on geographies consisting of 468,079,213 people shows a weak negative correlation between the proportion of Africans and household income with householder between the ages 25 and 44 in the United States with a correlation coefficient (R) of -0.202 and weighted average of $78,986. Similarly, the statistical analysis conducted on geographies consisting of 19,902,143 people shows a moderate negative correlation between the proportion of Yakama and household income with householder between the ages 25 and 44 in the United States with a correlation coefficient (R) of -0.451 and weighted average of $76,226, a difference of 3.6%.
Householder Income Ages 25 - 44 years Correlation Summary
| Measurement | African | Yakama |
| Minimum | $34,242 | $45,972 |
| Maximum | $109,792 | $99,532 |
| Range | $75,550 | $53,560 |
| Mean | $62,789 | $68,963 |
| Median | $62,232 | $66,512 |
| Interquartile 25% (IQ1) | $54,869 | $56,733 |
| Interquartile 75% (IQ3) | $71,404 | $82,417 |
| Interquartile Range (IQR) | $16,535 | $25,684 |
| Standard Deviation (Sample) | $14,499 | $14,961 |
| Standard Deviation (Population) | $14,367 | $14,600 |
Demographics Similar to Africans and Yakama by Householder Income Ages 25 - 44 years
In terms of householder income ages 25 - 44 years, the demographic groups most similar to Africans are Ottawa ($79,012, a difference of 0.030%), U.S. Virgin Islander ($78,911, a difference of 0.090%), Cheyenne ($79,152, a difference of 0.21%), Immigrants from Mexico ($78,809, a difference of 0.22%), and Menominee ($79,358, a difference of 0.47%). Similarly, the demographic groups most similar to Yakama are Seminole ($76,584, a difference of 0.47%), Immigrants from Cuba ($76,701, a difference of 0.62%), Native/Alaskan ($75,647, a difference of 0.76%), Immigrants from Bahamas ($76,910, a difference of 0.90%), and Houma ($77,044, a difference of 1.1%).
| Demographics | Rating | Rank | Householder Income Ages 25 - 44 years |
| Menominee | 0.0 /100 | #313 | Tragic $79,358 |
| Cheyenne | 0.0 /100 | #314 | Tragic $79,152 |
| Ottawa | 0.0 /100 | #315 | Tragic $79,012 |
| Africans | 0.0 /100 | #316 | Tragic $78,986 |
| U.S. Virgin Islanders | 0.0 /100 | #317 | Tragic $78,911 |
| Immigrants | Mexico | 0.0 /100 | #318 | Tragic $78,809 |
| Hondurans | 0.0 /100 | #319 | Tragic $78,540 |
| Choctaw | 0.0 /100 | #320 | Tragic $78,168 |
| Immigrants | Zaire | 0.0 /100 | #321 | Tragic $78,045 |
| Chickasaw | 0.0 /100 | #322 | Tragic $77,929 |
| Immigrants | Honduras | 0.0 /100 | #323 | Tragic $77,328 |
| Dutch West Indians | 0.0 /100 | #324 | Tragic $77,260 |
| Sioux | 0.0 /100 | #325 | Tragic $77,089 |
| Houma | 0.0 /100 | #326 | Tragic $77,044 |
| Immigrants | Bahamas | 0.0 /100 | #327 | Tragic $76,910 |
| Immigrants | Cuba | 0.0 /100 | #328 | Tragic $76,701 |
| Seminole | 0.0 /100 | #329 | Tragic $76,584 |
| Yakama | 0.0 /100 | #330 | Tragic $76,226 |
| Natives/Alaskans | 0.0 /100 | #331 | Tragic $75,647 |
| Bahamians | 0.0 /100 | #332 | Tragic $75,395 |
| Hopi | 0.0 /100 | #333 | Tragic $75,002 |