Immigrants from Yemen vs Irish Householder Income Ages 25 - 44 years
COMPARE
Immigrants from Yemen
Irish
Householder Income Ages 25 - 44 years
Householder Income Ages 25 - 44 years Comparison
Immigrants from Yemen
Irish
$73,043
HOUSEHOLDER INCOME AGES 25 - 44 YEARS
0.0/ 100
METRIC RATING
338th/ 347
METRIC RANK
$96,730
HOUSEHOLDER INCOME AGES 25 - 44 YEARS
76.9/ 100
METRIC RATING
148th/ 347
METRIC RANK
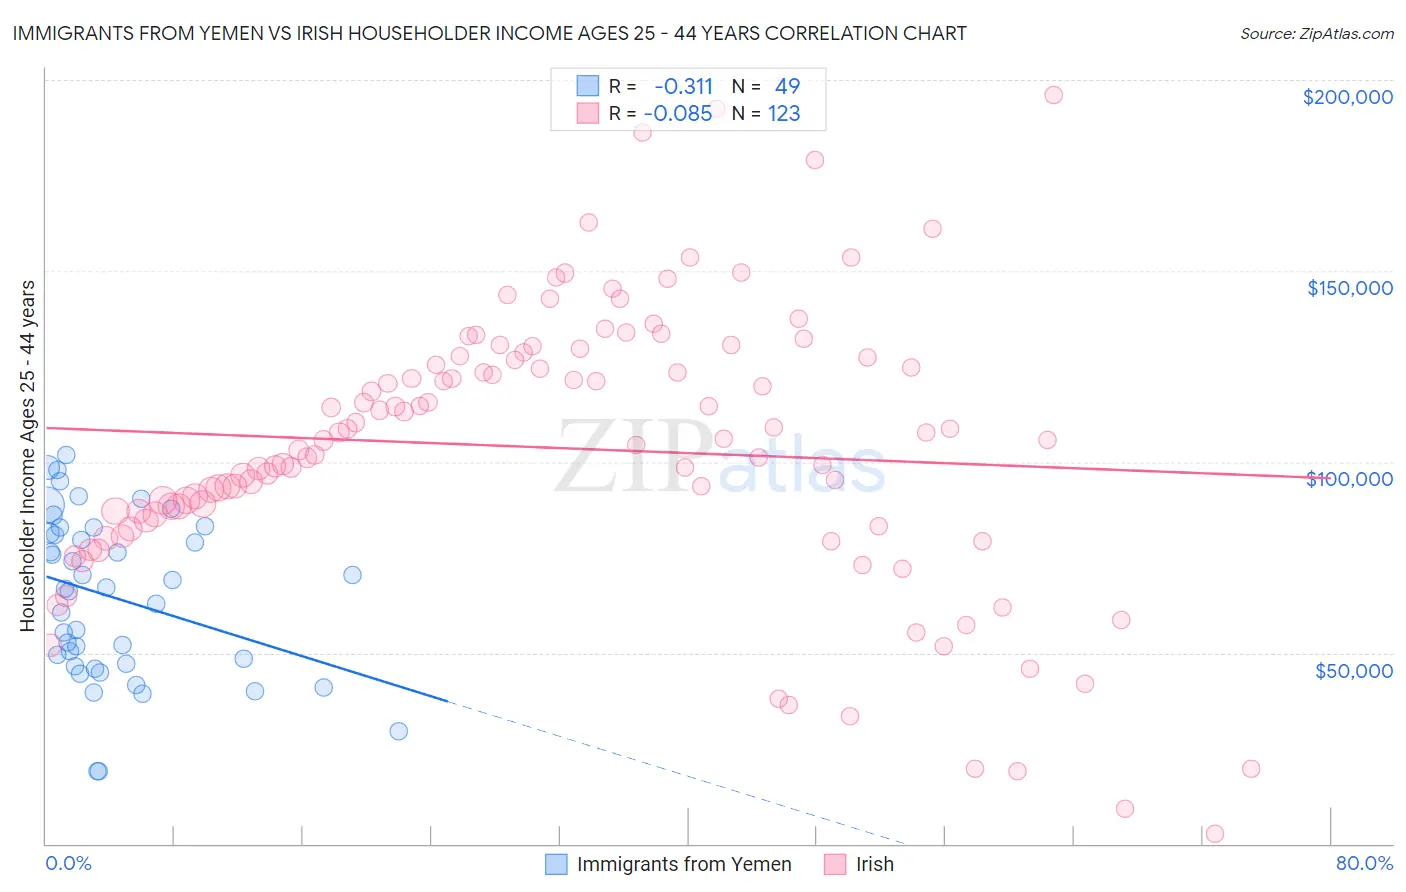
Immigrants from Yemen vs Irish Householder Income Ages 25 - 44 years Correlation Chart
The statistical analysis conducted on geographies consisting of 82,403,741 people shows a mild negative correlation between the proportion of Immigrants from Yemen and household income with householder between the ages 25 and 44 in the United States with a correlation coefficient (R) of -0.311 and weighted average of $73,043. Similarly, the statistical analysis conducted on geographies consisting of 572,831,094 people shows a slight negative correlation between the proportion of Irish and household income with householder between the ages 25 and 44 in the United States with a correlation coefficient (R) of -0.085 and weighted average of $96,730, a difference of 32.4%.
Householder Income Ages 25 - 44 years Correlation Summary
| Measurement | Immigrants from Yemen | Irish |
| Minimum | $18,875 | $2,499 |
| Maximum | $101,667 | $195,924 |
| Range | $82,792 | $193,425 |
| Mean | $64,384 | $103,698 |
| Median | $66,841 | $105,634 |
| Interquartile 25% (IQ1) | $46,776 | $84,609 |
| Interquartile 75% (IQ3) | $82,060 | $127,232 |
| Interquartile Range (IQR) | $35,284 | $42,623 |
| Standard Deviation (Sample) | $21,181 | $36,620 |
| Standard Deviation (Population) | $20,964 | $36,470 |
Similar Demographics by Householder Income Ages 25 - 44 years
Demographics Similar to Immigrants from Yemen by Householder Income Ages 25 - 44 years
In terms of householder income ages 25 - 44 years, the demographic groups most similar to Immigrants from Yemen are Yuman ($72,956, a difference of 0.12%), Black/African American ($73,370, a difference of 0.45%), Yup'ik ($73,688, a difference of 0.88%), Immigrants from Congo ($72,178, a difference of 1.2%), and Arapaho ($71,697, a difference of 1.9%).
| Demographics | Rating | Rank | Householder Income Ages 25 - 44 years |
| Natives/Alaskans | 0.0 /100 | #331 | Tragic $75,647 |
| Bahamians | 0.0 /100 | #332 | Tragic $75,395 |
| Hopi | 0.0 /100 | #333 | Tragic $75,002 |
| Creek | 0.0 /100 | #334 | Tragic $74,847 |
| Kiowa | 0.0 /100 | #335 | Tragic $74,776 |
| Yup'ik | 0.0 /100 | #336 | Tragic $73,688 |
| Blacks/African Americans | 0.0 /100 | #337 | Tragic $73,370 |
| Immigrants | Yemen | 0.0 /100 | #338 | Tragic $73,043 |
| Yuman | 0.0 /100 | #339 | Tragic $72,956 |
| Immigrants | Congo | 0.0 /100 | #340 | Tragic $72,178 |
| Arapaho | 0.0 /100 | #341 | Tragic $71,697 |
| Crow | 0.0 /100 | #342 | Tragic $71,337 |
| Tohono O'odham | 0.0 /100 | #343 | Tragic $69,068 |
| Pueblo | 0.0 /100 | #344 | Tragic $68,910 |
| Navajo | 0.0 /100 | #345 | Tragic $66,529 |
Demographics Similar to Irish by Householder Income Ages 25 - 44 years
In terms of householder income ages 25 - 44 years, the demographic groups most similar to Irish are Basque ($96,709, a difference of 0.020%), Immigrants from Syria ($96,789, a difference of 0.060%), Ugandan ($96,667, a difference of 0.070%), Ethiopian ($96,824, a difference of 0.10%), and Norwegian ($96,866, a difference of 0.14%).
| Demographics | Rating | Rank | Householder Income Ages 25 - 44 years |
| Luxembourgers | 81.5 /100 | #141 | Excellent $97,237 |
| Danes | 81.3 /100 | #142 | Excellent $97,221 |
| Immigrants | Jordan | 81.0 /100 | #143 | Excellent $97,185 |
| Immigrants | Chile | 80.8 /100 | #144 | Excellent $97,159 |
| Norwegians | 78.2 /100 | #145 | Good $96,866 |
| Ethiopians | 77.8 /100 | #146 | Good $96,824 |
| Immigrants | Syria | 77.4 /100 | #147 | Good $96,789 |
| Irish | 76.9 /100 | #148 | Good $96,730 |
| Basques | 76.6 /100 | #149 | Good $96,709 |
| Ugandans | 76.2 /100 | #150 | Good $96,667 |
| Czechs | 74.8 /100 | #151 | Good $96,525 |
| South American Indians | 74.5 /100 | #152 | Good $96,497 |
| Slovenes | 73.9 /100 | #153 | Good $96,439 |
| Slavs | 73.2 /100 | #154 | Good $96,377 |
| Moroccans | 70.3 /100 | #155 | Good $96,117 |