Pima vs Jordanian Householder Income Ages 25 - 44 years
COMPARE
Pima
Jordanian
Householder Income Ages 25 - 44 years
Householder Income Ages 25 - 44 years Comparison
Pima
Jordanians
$82,821
HOUSEHOLDER INCOME AGES 25 - 44 YEARS
0.1/ 100
METRIC RATING
279th/ 347
METRIC RANK
$99,186
HOUSEHOLDER INCOME AGES 25 - 44 YEARS
92.8/ 100
METRIC RATING
119th/ 347
METRIC RANK
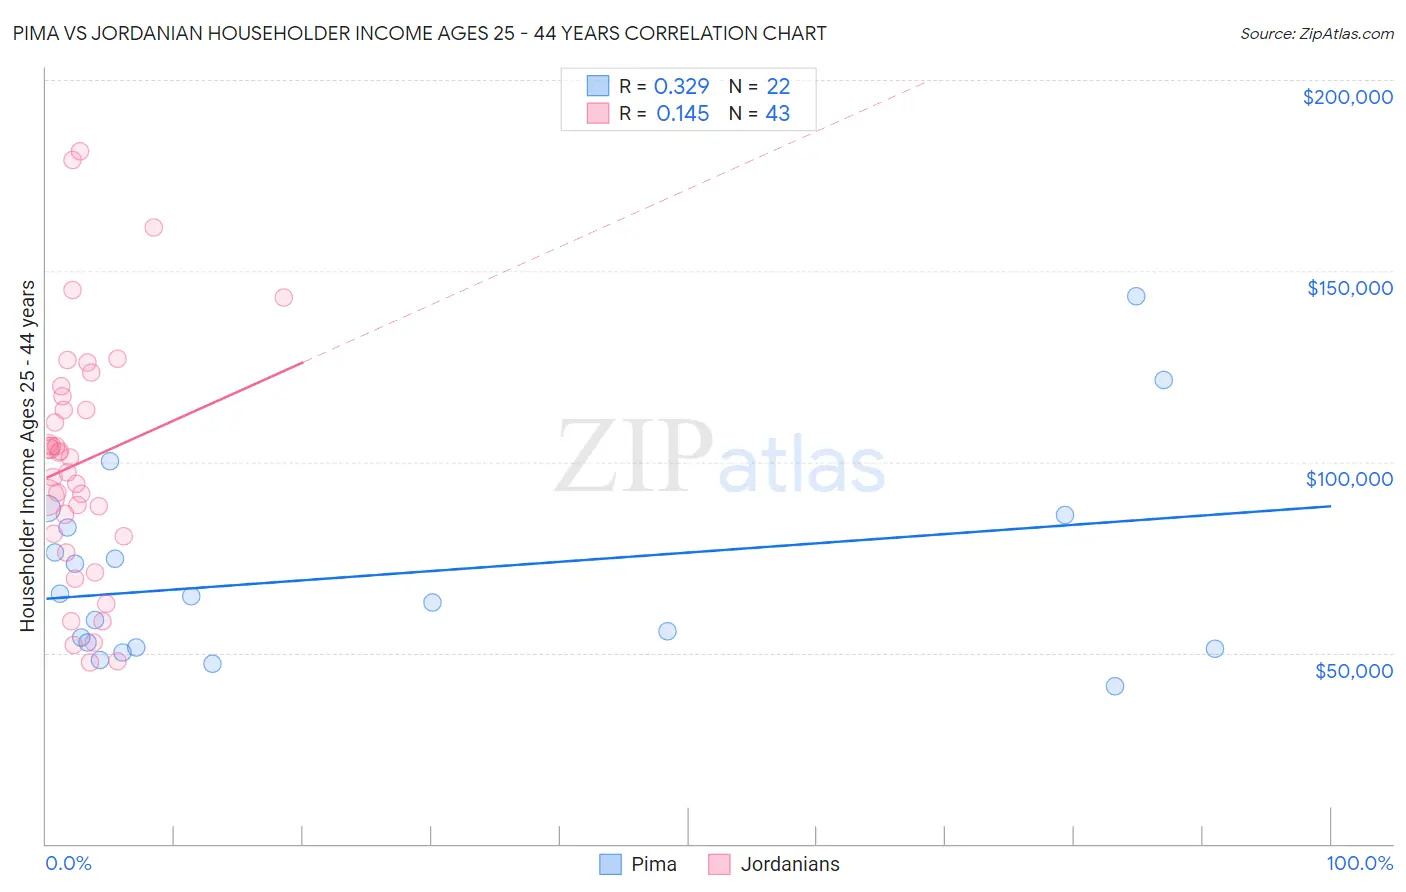
Pima vs Jordanian Householder Income Ages 25 - 44 years Correlation Chart
The statistical analysis conducted on geographies consisting of 61,441,839 people shows a mild positive correlation between the proportion of Pima and household income with householder between the ages 25 and 44 in the United States with a correlation coefficient (R) of 0.329 and weighted average of $82,821. Similarly, the statistical analysis conducted on geographies consisting of 166,327,979 people shows a poor positive correlation between the proportion of Jordanians and household income with householder between the ages 25 and 44 in the United States with a correlation coefficient (R) of 0.145 and weighted average of $99,186, a difference of 19.8%.
Householder Income Ages 25 - 44 years Correlation Summary
| Measurement | Pima | Jordanian |
| Minimum | $41,167 | $47,305 |
| Maximum | $143,258 | $181,494 |
| Range | $102,091 | $134,189 |
| Mean | $70,457 | $99,931 |
| Median | $64,038 | $101,206 |
| Interquartile 25% (IQ1) | $51,500 | $80,556 |
| Interquartile 75% (IQ3) | $82,898 | $117,253 |
| Interquartile Range (IQR) | $31,398 | $36,697 |
| Standard Deviation (Sample) | $25,507 | $32,051 |
| Standard Deviation (Population) | $24,921 | $31,676 |
Similar Demographics by Householder Income Ages 25 - 44 years
Demographics Similar to Pima by Householder Income Ages 25 - 44 years
In terms of householder income ages 25 - 44 years, the demographic groups most similar to Pima are Senegalese ($82,852, a difference of 0.040%), Paiute ($82,984, a difference of 0.20%), Colville ($82,604, a difference of 0.26%), Immigrants from Belize ($83,141, a difference of 0.39%), and Cajun ($82,393, a difference of 0.52%).
| Demographics | Rating | Rank | Householder Income Ages 25 - 44 years |
| Spanish Americans | 0.2 /100 | #272 | Tragic $83,722 |
| Iroquois | 0.2 /100 | #273 | Tragic $83,682 |
| Marshallese | 0.2 /100 | #274 | Tragic $83,575 |
| Immigrants | Jamaica | 0.2 /100 | #275 | Tragic $83,298 |
| Immigrants | Belize | 0.2 /100 | #276 | Tragic $83,141 |
| Paiute | 0.2 /100 | #277 | Tragic $82,984 |
| Senegalese | 0.2 /100 | #278 | Tragic $82,852 |
| Pima | 0.1 /100 | #279 | Tragic $82,821 |
| Colville | 0.1 /100 | #280 | Tragic $82,604 |
| Cajuns | 0.1 /100 | #281 | Tragic $82,393 |
| Central American Indians | 0.1 /100 | #282 | Tragic $82,355 |
| Guatemalans | 0.1 /100 | #283 | Tragic $82,331 |
| Immigrants | Middle Africa | 0.1 /100 | #284 | Tragic $82,254 |
| Immigrants | Somalia | 0.1 /100 | #285 | Tragic $82,188 |
| Ute | 0.1 /100 | #286 | Tragic $82,166 |
Demographics Similar to Jordanians by Householder Income Ages 25 - 44 years
In terms of householder income ages 25 - 44 years, the demographic groups most similar to Jordanians are Syrian ($99,215, a difference of 0.030%), Immigrants from Northern Africa ($99,232, a difference of 0.050%), Swedish ($99,136, a difference of 0.050%), Portuguese ($99,429, a difference of 0.24%), and Carpatho Rusyn ($99,449, a difference of 0.27%).
| Demographics | Rating | Rank | Householder Income Ages 25 - 44 years |
| Poles | 94.5 /100 | #112 | Exceptional $99,685 |
| Tongans | 94.2 /100 | #113 | Exceptional $99,604 |
| Immigrants | Western Asia | 94.0 /100 | #114 | Exceptional $99,516 |
| Carpatho Rusyns | 93.7 /100 | #115 | Exceptional $99,449 |
| Portuguese | 93.7 /100 | #116 | Exceptional $99,429 |
| Immigrants | Northern Africa | 93.0 /100 | #117 | Exceptional $99,232 |
| Syrians | 92.9 /100 | #118 | Exceptional $99,215 |
| Jordanians | 92.8 /100 | #119 | Exceptional $99,186 |
| Swedes | 92.7 /100 | #120 | Exceptional $99,136 |
| Peruvians | 91.7 /100 | #121 | Exceptional $98,886 |
| Immigrants | Uzbekistan | 91.5 /100 | #122 | Exceptional $98,849 |
| Palestinians | 91.2 /100 | #123 | Exceptional $98,777 |
| Zimbabweans | 90.3 /100 | #124 | Exceptional $98,586 |
| Pakistanis | 89.3 /100 | #125 | Excellent $98,401 |
| British | 89.1 /100 | #126 | Excellent $98,359 |