Immigrants from Yemen vs Pueblo Median Family Income
COMPARE
Immigrants from Yemen
Pueblo
Median Family Income
Median Family Income Comparison
Immigrants from Yemen
Pueblo
$77,457
MEDIAN FAMILY INCOME
0.0/ 100
METRIC RATING
338th/ 347
METRIC RANK
$76,880
MEDIAN FAMILY INCOME
0.0/ 100
METRIC RATING
341st/ 347
METRIC RANK
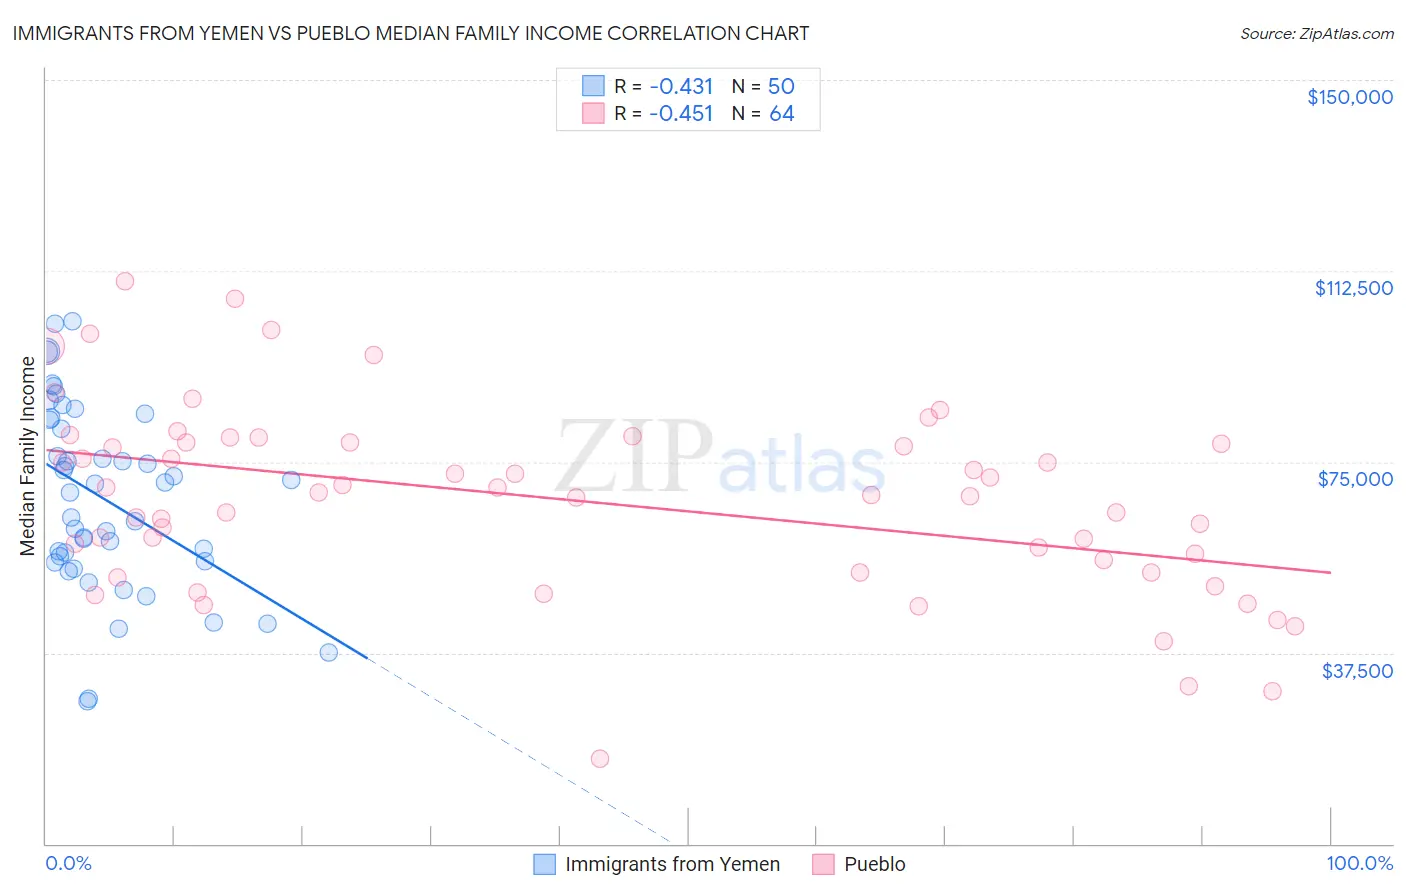
Immigrants from Yemen vs Pueblo Median Family Income Correlation Chart
The statistical analysis conducted on geographies consisting of 82,428,654 people shows a moderate negative correlation between the proportion of Immigrants from Yemen and median family income in the United States with a correlation coefficient (R) of -0.431 and weighted average of $77,457. Similarly, the statistical analysis conducted on geographies consisting of 120,047,767 people shows a moderate negative correlation between the proportion of Pueblo and median family income in the United States with a correlation coefficient (R) of -0.451 and weighted average of $76,880, a difference of 0.75%.
Median Family Income Correlation Summary
| Measurement | Immigrants from Yemen | Pueblo |
| Minimum | $28,000 | $16,806 |
| Maximum | $102,670 | $110,375 |
| Range | $74,670 | $93,569 |
| Mean | $67,712 | $67,508 |
| Median | $69,869 | $68,832 |
| Interquartile 25% (IQ1) | $55,430 | $54,583 |
| Interquartile 75% (IQ3) | $83,169 | $78,820 |
| Interquartile Range (IQR) | $27,739 | $24,237 |
| Standard Deviation (Sample) | $18,166 | $18,534 |
| Standard Deviation (Population) | $17,984 | $18,389 |
Demographics Similar to Immigrants from Yemen and Pueblo by Median Family Income
In terms of median family income, the demographic groups most similar to Immigrants from Yemen are Pima ($77,431, a difference of 0.030%), Hopi ($77,188, a difference of 0.35%), Yuman ($78,055, a difference of 0.77%), Immigrants from Cuba ($78,249, a difference of 1.0%), and Crow ($76,605, a difference of 1.1%). Similarly, the demographic groups most similar to Pueblo are Crow ($76,605, a difference of 0.36%), Hopi ($77,188, a difference of 0.40%), Pima ($77,431, a difference of 0.72%), Houma ($76,188, a difference of 0.91%), and Yuman ($78,055, a difference of 1.5%).
| Demographics | Rating | Rank | Median Family Income |
| Blacks/African Americans | 0.0 /100 | #328 | Tragic $81,912 |
| Dutch West Indians | 0.0 /100 | #329 | Tragic $81,852 |
| Cheyenne | 0.0 /100 | #330 | Tragic $81,385 |
| Immigrants | Dominican Republic | 0.0 /100 | #331 | Tragic $81,233 |
| Natives/Alaskans | 0.0 /100 | #332 | Tragic $80,908 |
| Kiowa | 0.0 /100 | #333 | Tragic $80,885 |
| Menominee | 0.0 /100 | #334 | Tragic $79,563 |
| Yup'ik | 0.0 /100 | #335 | Tragic $79,290 |
| Immigrants | Cuba | 0.0 /100 | #336 | Tragic $78,249 |
| Yuman | 0.0 /100 | #337 | Tragic $78,055 |
| Immigrants | Yemen | 0.0 /100 | #338 | Tragic $77,457 |
| Pima | 0.0 /100 | #339 | Tragic $77,431 |
| Hopi | 0.0 /100 | #340 | Tragic $77,188 |
| Pueblo | 0.0 /100 | #341 | Tragic $76,880 |
| Crow | 0.0 /100 | #342 | Tragic $76,605 |
| Houma | 0.0 /100 | #343 | Tragic $76,188 |
| Tohono O'odham | 0.0 /100 | #344 | Tragic $72,193 |
| Navajo | 0.0 /100 | #345 | Tragic $70,989 |
| Puerto Ricans | 0.0 /100 | #346 | Tragic $70,423 |
| Lumbee | 0.0 /100 | #347 | Tragic $68,679 |