Immigrants from Yemen vs Filipino Householder Income Ages 25 - 44 years
COMPARE
Immigrants from Yemen
Filipino
Householder Income Ages 25 - 44 years
Householder Income Ages 25 - 44 years Comparison
Immigrants from Yemen
Filipinos
$73,043
HOUSEHOLDER INCOME AGES 25 - 44 YEARS
0.0/ 100
METRIC RATING
338th/ 347
METRIC RANK
$128,723
HOUSEHOLDER INCOME AGES 25 - 44 YEARS
100.0/ 100
METRIC RATING
2nd/ 347
METRIC RANK
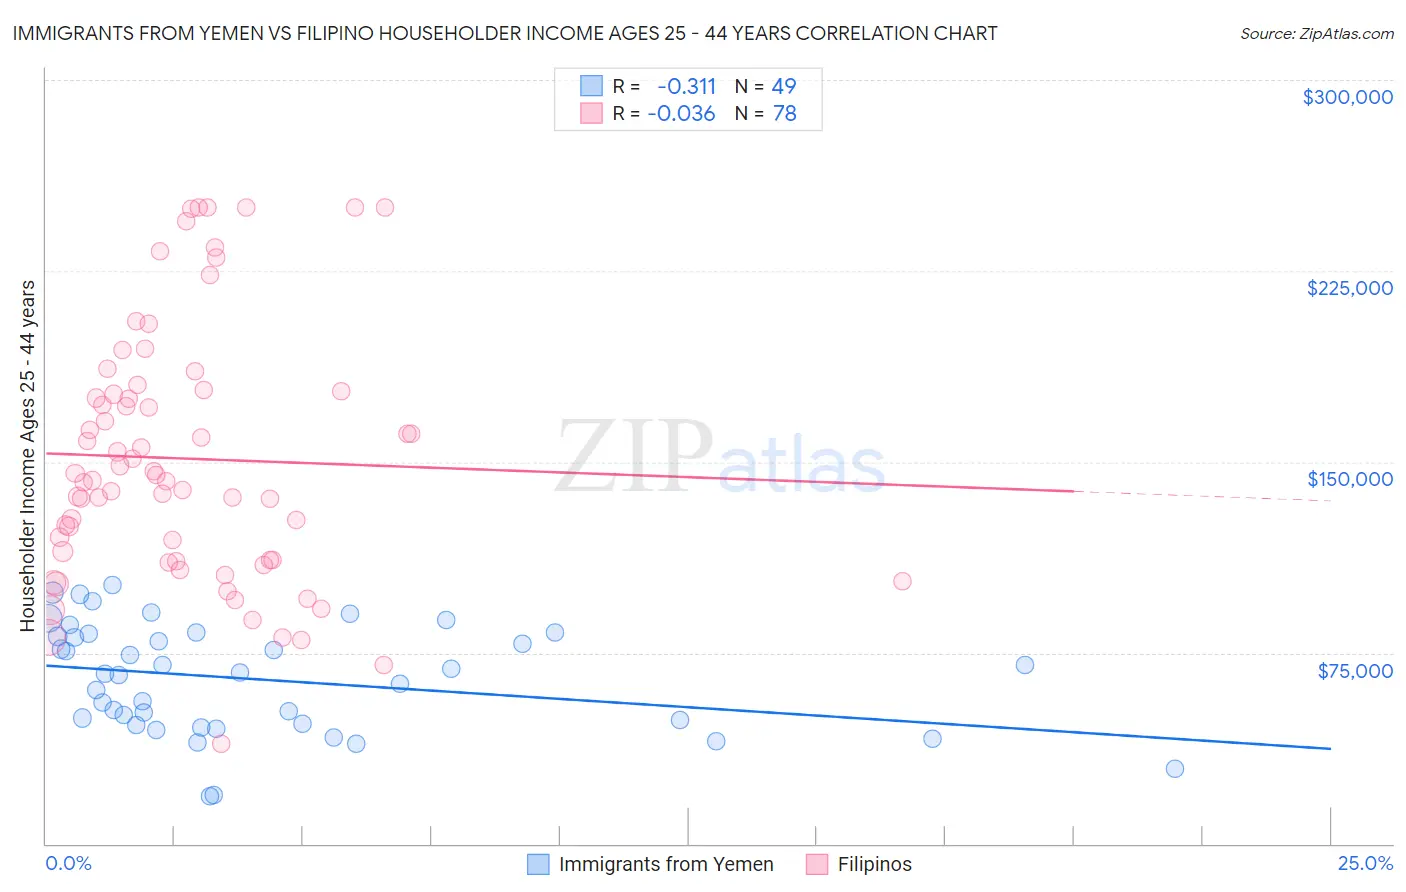
Immigrants from Yemen vs Filipino Householder Income Ages 25 - 44 years Correlation Chart
The statistical analysis conducted on geographies consisting of 82,403,741 people shows a mild negative correlation between the proportion of Immigrants from Yemen and household income with householder between the ages 25 and 44 in the United States with a correlation coefficient (R) of -0.311 and weighted average of $73,043. Similarly, the statistical analysis conducted on geographies consisting of 253,933,050 people shows no correlation between the proportion of Filipinos and household income with householder between the ages 25 and 44 in the United States with a correlation coefficient (R) of -0.036 and weighted average of $128,723, a difference of 76.2%.
Householder Income Ages 25 - 44 years Correlation Summary
| Measurement | Immigrants from Yemen | Filipino |
| Minimum | $18,875 | $39,375 |
| Maximum | $101,667 | $250,001 |
| Range | $82,792 | $210,626 |
| Mean | $64,384 | $151,257 |
| Median | $66,841 | $143,621 |
| Interquartile 25% (IQ1) | $46,776 | $111,424 |
| Interquartile 75% (IQ3) | $82,060 | $177,500 |
| Interquartile Range (IQR) | $35,284 | $66,076 |
| Standard Deviation (Sample) | $21,181 | $49,784 |
| Standard Deviation (Population) | $20,964 | $49,463 |
Similar Demographics by Householder Income Ages 25 - 44 years
Demographics Similar to Immigrants from Yemen by Householder Income Ages 25 - 44 years
In terms of householder income ages 25 - 44 years, the demographic groups most similar to Immigrants from Yemen are Yuman ($72,956, a difference of 0.12%), Black/African American ($73,370, a difference of 0.45%), Yup'ik ($73,688, a difference of 0.88%), Immigrants from Congo ($72,178, a difference of 1.2%), and Arapaho ($71,697, a difference of 1.9%).
| Demographics | Rating | Rank | Householder Income Ages 25 - 44 years |
| Natives/Alaskans | 0.0 /100 | #331 | Tragic $75,647 |
| Bahamians | 0.0 /100 | #332 | Tragic $75,395 |
| Hopi | 0.0 /100 | #333 | Tragic $75,002 |
| Creek | 0.0 /100 | #334 | Tragic $74,847 |
| Kiowa | 0.0 /100 | #335 | Tragic $74,776 |
| Yup'ik | 0.0 /100 | #336 | Tragic $73,688 |
| Blacks/African Americans | 0.0 /100 | #337 | Tragic $73,370 |
| Immigrants | Yemen | 0.0 /100 | #338 | Tragic $73,043 |
| Yuman | 0.0 /100 | #339 | Tragic $72,956 |
| Immigrants | Congo | 0.0 /100 | #340 | Tragic $72,178 |
| Arapaho | 0.0 /100 | #341 | Tragic $71,697 |
| Crow | 0.0 /100 | #342 | Tragic $71,337 |
| Tohono O'odham | 0.0 /100 | #343 | Tragic $69,068 |
| Pueblo | 0.0 /100 | #344 | Tragic $68,910 |
| Navajo | 0.0 /100 | #345 | Tragic $66,529 |
Demographics Similar to Filipinos by Householder Income Ages 25 - 44 years
In terms of householder income ages 25 - 44 years, the demographic groups most similar to Filipinos are Immigrants from Taiwan ($129,122, a difference of 0.31%), Immigrants from Hong Kong ($128,140, a difference of 0.45%), Immigrants from Singapore ($124,429, a difference of 3.5%), Immigrants from India ($124,238, a difference of 3.6%), and Thai ($121,778, a difference of 5.7%).
| Demographics | Rating | Rank | Householder Income Ages 25 - 44 years |
| Immigrants | Taiwan | 100.0 /100 | #1 | Exceptional $129,122 |
| Filipinos | 100.0 /100 | #2 | Exceptional $128,723 |
| Immigrants | Hong Kong | 100.0 /100 | #3 | Exceptional $128,140 |
| Immigrants | Singapore | 100.0 /100 | #4 | Exceptional $124,429 |
| Immigrants | India | 100.0 /100 | #5 | Exceptional $124,238 |
| Thais | 100.0 /100 | #6 | Exceptional $121,778 |
| Immigrants | Ireland | 100.0 /100 | #7 | Exceptional $120,333 |
| Iranians | 100.0 /100 | #8 | Exceptional $120,292 |
| Immigrants | China | 100.0 /100 | #9 | Exceptional $119,756 |
| Indians (Asian) | 100.0 /100 | #10 | Exceptional $119,496 |
| Okinawans | 100.0 /100 | #11 | Exceptional $119,349 |
| Immigrants | Iran | 100.0 /100 | #12 | Exceptional $119,204 |
| Immigrants | Eastern Asia | 100.0 /100 | #13 | Exceptional $118,056 |
| Immigrants | Israel | 100.0 /100 | #14 | Exceptional $117,219 |
| Immigrants | South Central Asia | 100.0 /100 | #15 | Exceptional $116,626 |