Immigrants from Western Europe vs Bahamian Per Capita Income
COMPARE
Immigrants from Western Europe
Bahamian
Per Capita Income
Per Capita Income Comparison
Immigrants from Western Europe
Bahamians
$50,065
PER CAPITA INCOME
99.9/ 100
METRIC RATING
55th/ 347
METRIC RANK
$36,427
PER CAPITA INCOME
0.0/ 100
METRIC RATING
313th/ 347
METRIC RANK
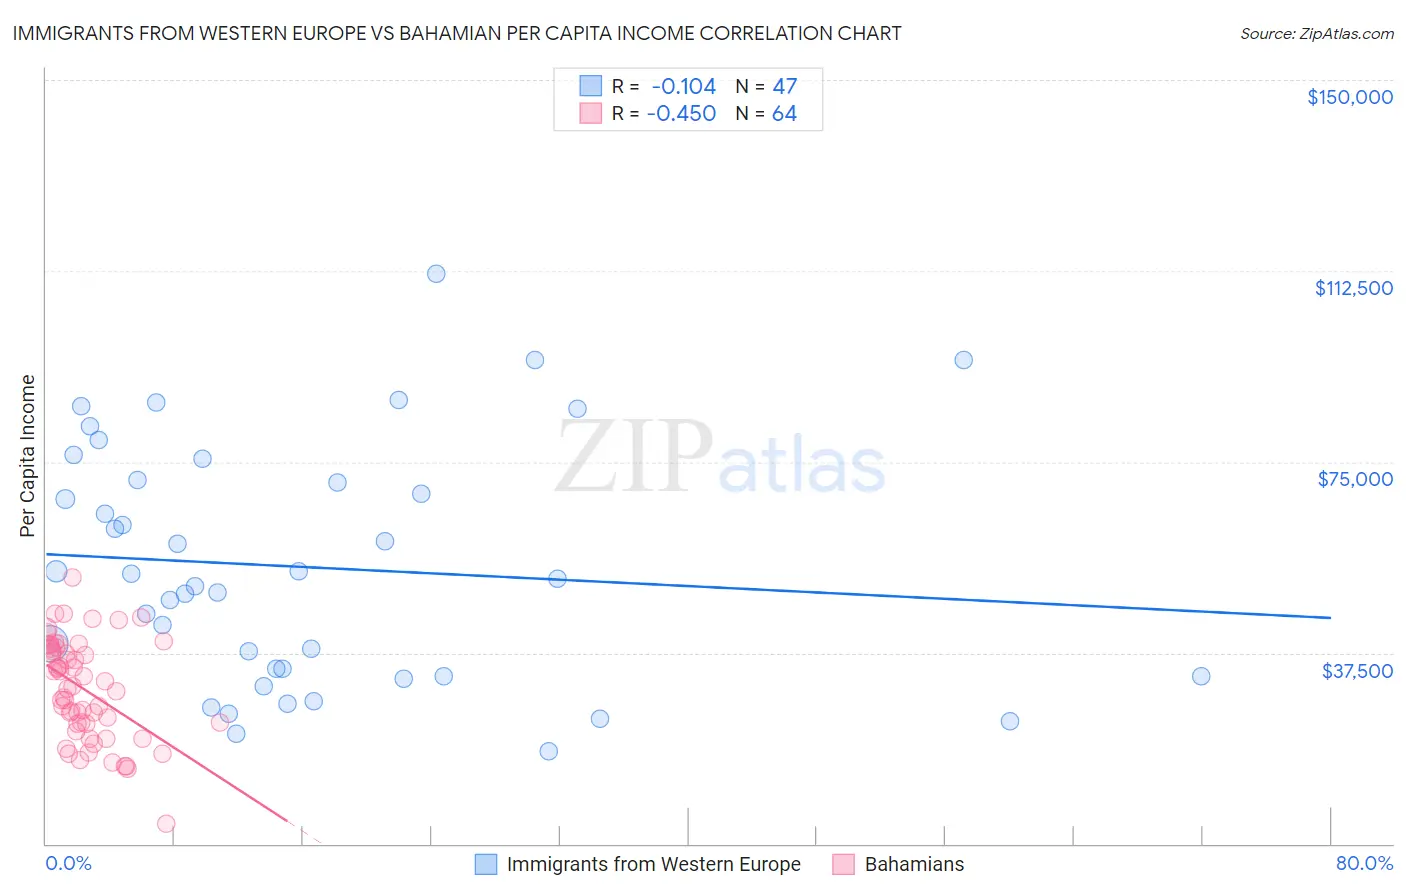
Immigrants from Western Europe vs Bahamian Per Capita Income Correlation Chart
The statistical analysis conducted on geographies consisting of 494,094,837 people shows a poor negative correlation between the proportion of Immigrants from Western Europe and per capita income in the United States with a correlation coefficient (R) of -0.104 and weighted average of $50,065. Similarly, the statistical analysis conducted on geographies consisting of 112,707,980 people shows a moderate negative correlation between the proportion of Bahamians and per capita income in the United States with a correlation coefficient (R) of -0.450 and weighted average of $36,427, a difference of 37.4%.
Per Capita Income Correlation Summary
| Measurement | Immigrants from Western Europe | Bahamian |
| Minimum | $18,269 | $3,864 |
| Maximum | $111,976 | $52,210 |
| Range | $93,707 | $48,346 |
| Mean | $54,316 | $30,310 |
| Median | $51,952 | $30,639 |
| Interquartile 25% (IQ1) | $33,002 | $23,571 |
| Interquartile 75% (IQ3) | $71,320 | $38,367 |
| Interquartile Range (IQR) | $38,319 | $14,797 |
| Standard Deviation (Sample) | $23,455 | $9,801 |
| Standard Deviation (Population) | $23,204 | $9,724 |
Similar Demographics by Per Capita Income
Demographics Similar to Immigrants from Western Europe by Per Capita Income
In terms of per capita income, the demographic groups most similar to Immigrants from Western Europe are Asian ($50,057, a difference of 0.020%), South African ($50,044, a difference of 0.040%), Immigrants from Malaysia ($49,983, a difference of 0.16%), Bhutanese ($49,894, a difference of 0.34%), and Immigrants from Scotland ($49,893, a difference of 0.34%).
| Demographics | Rating | Rank | Per Capita Income |
| Immigrants | Serbia | 100.0 /100 | #48 | Exceptional $50,810 |
| New Zealanders | 100.0 /100 | #49 | Exceptional $50,575 |
| Immigrants | Sri Lanka | 100.0 /100 | #50 | Exceptional $50,555 |
| Immigrants | Netherlands | 100.0 /100 | #51 | Exceptional $50,458 |
| Immigrants | Croatia | 99.9 /100 | #52 | Exceptional $50,417 |
| Paraguayans | 99.9 /100 | #53 | Exceptional $50,385 |
| Immigrants | Belarus | 99.9 /100 | #54 | Exceptional $50,303 |
| Immigrants | Western Europe | 99.9 /100 | #55 | Exceptional $50,065 |
| Asians | 99.9 /100 | #56 | Exceptional $50,057 |
| South Africans | 99.9 /100 | #57 | Exceptional $50,044 |
| Immigrants | Malaysia | 99.9 /100 | #58 | Exceptional $49,983 |
| Bhutanese | 99.9 /100 | #59 | Exceptional $49,894 |
| Immigrants | Scotland | 99.9 /100 | #60 | Exceptional $49,893 |
| Argentineans | 99.9 /100 | #61 | Exceptional $49,862 |
| Immigrants | Asia | 99.9 /100 | #62 | Exceptional $49,741 |
Demographics Similar to Bahamians by Per Capita Income
In terms of per capita income, the demographic groups most similar to Bahamians are Chickasaw ($36,475, a difference of 0.13%), Chippewa ($36,631, a difference of 0.56%), Ute ($36,651, a difference of 0.62%), Immigrants from Honduras ($36,665, a difference of 0.65%), and Seminole ($36,180, a difference of 0.68%).
| Demographics | Rating | Rank | Per Capita Income |
| Immigrants | Haiti | 0.0 /100 | #306 | Tragic $36,849 |
| Immigrants | Latin America | 0.0 /100 | #307 | Tragic $36,823 |
| Fijians | 0.0 /100 | #308 | Tragic $36,690 |
| Immigrants | Honduras | 0.0 /100 | #309 | Tragic $36,665 |
| Ute | 0.0 /100 | #310 | Tragic $36,651 |
| Chippewa | 0.0 /100 | #311 | Tragic $36,631 |
| Chickasaw | 0.0 /100 | #312 | Tragic $36,475 |
| Bahamians | 0.0 /100 | #313 | Tragic $36,427 |
| Seminole | 0.0 /100 | #314 | Tragic $36,180 |
| Yaqui | 0.0 /100 | #315 | Tragic $36,112 |
| Choctaw | 0.0 /100 | #316 | Tragic $35,999 |
| Dutch West Indians | 0.0 /100 | #317 | Tragic $35,922 |
| Bangladeshis | 0.0 /100 | #318 | Tragic $35,897 |
| Immigrants | Congo | 0.0 /100 | #319 | Tragic $35,720 |
| Hispanics or Latinos | 0.0 /100 | #320 | Tragic $35,688 |