Dominican vs Swedish Median Household Income
COMPARE
Dominican
Swedish
Median Household Income
Median Household Income Comparison
Dominicans
Swedes
$71,302
MEDIAN HOUSEHOLD INCOME
0.0/ 100
METRIC RATING
314th/ 347
METRIC RANK
$88,524
MEDIAN HOUSEHOLD INCOME
90.0/ 100
METRIC RATING
134th/ 347
METRIC RANK
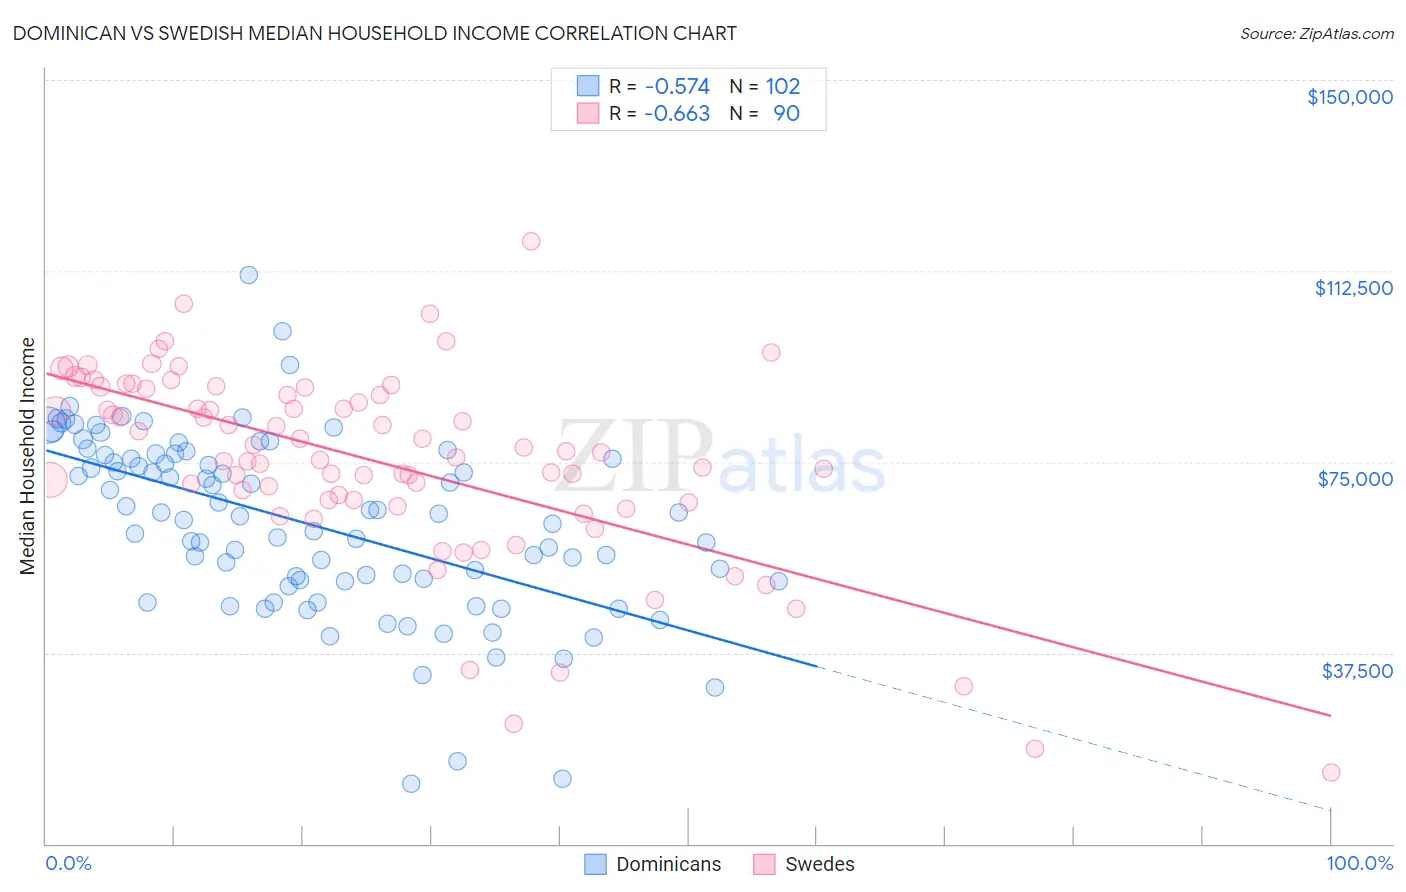
Dominican vs Swedish Median Household Income Correlation Chart
The statistical analysis conducted on geographies consisting of 354,675,302 people shows a substantial negative correlation between the proportion of Dominicans and median household income in the United States with a correlation coefficient (R) of -0.574 and weighted average of $71,302. Similarly, the statistical analysis conducted on geographies consisting of 538,472,836 people shows a significant negative correlation between the proportion of Swedes and median household income in the United States with a correlation coefficient (R) of -0.663 and weighted average of $88,524, a difference of 24.1%.
Median Household Income Correlation Summary
| Measurement | Dominican | Swedish |
| Minimum | $11,801 | $14,107 |
| Maximum | $111,701 | $118,333 |
| Range | $99,900 | $104,226 |
| Mean | $62,844 | $75,217 |
| Median | $64,590 | $76,969 |
| Interquartile 25% (IQ1) | $51,574 | $67,408 |
| Interquartile 75% (IQ3) | $76,260 | $89,464 |
| Interquartile Range (IQR) | $24,686 | $22,056 |
| Standard Deviation (Sample) | $17,716 | $18,981 |
| Standard Deviation (Population) | $17,629 | $18,875 |
Similar Demographics by Median Household Income
Demographics Similar to Dominicans by Median Household Income
In terms of median household income, the demographic groups most similar to Dominicans are Immigrants from Bahamas ($71,349, a difference of 0.060%), Immigrants from Honduras ($71,452, a difference of 0.21%), Ottawa ($70,984, a difference of 0.45%), Apache ($70,927, a difference of 0.53%), and Immigrants from Zaire ($71,801, a difference of 0.70%).
| Demographics | Rating | Rank | Median Household Income |
| Ute | 0.0 /100 | #307 | Tragic $72,402 |
| Yakama | 0.0 /100 | #308 | Tragic $72,225 |
| Immigrants | Caribbean | 0.0 /100 | #309 | Tragic $71,860 |
| U.S. Virgin Islanders | 0.0 /100 | #310 | Tragic $71,853 |
| Immigrants | Zaire | 0.0 /100 | #311 | Tragic $71,801 |
| Immigrants | Honduras | 0.0 /100 | #312 | Tragic $71,452 |
| Immigrants | Bahamas | 0.0 /100 | #313 | Tragic $71,349 |
| Dominicans | 0.0 /100 | #314 | Tragic $71,302 |
| Ottawa | 0.0 /100 | #315 | Tragic $70,984 |
| Apache | 0.0 /100 | #316 | Tragic $70,927 |
| Cajuns | 0.0 /100 | #317 | Tragic $70,605 |
| Chippewa | 0.0 /100 | #318 | Tragic $70,539 |
| Immigrants | Dominican Republic | 0.0 /100 | #319 | Tragic $70,208 |
| Colville | 0.0 /100 | #320 | Tragic $70,094 |
| Chickasaw | 0.0 /100 | #321 | Tragic $70,005 |
Demographics Similar to Swedes by Median Household Income
In terms of median household income, the demographic groups most similar to Swedes are Immigrants from Sierra Leone ($88,498, a difference of 0.030%), Polish ($88,472, a difference of 0.060%), Sierra Leonean ($88,463, a difference of 0.070%), Arab ($88,398, a difference of 0.14%), and Immigrants from Chile ($88,388, a difference of 0.15%).
| Demographics | Rating | Rank | Median Household Income |
| Immigrants | Peru | 92.5 /100 | #127 | Exceptional $89,010 |
| Portuguese | 92.3 /100 | #128 | Exceptional $88,976 |
| Brazilians | 92.1 /100 | #129 | Exceptional $88,934 |
| British | 92.0 /100 | #130 | Exceptional $88,914 |
| Immigrants | Syria | 91.4 /100 | #131 | Exceptional $88,792 |
| Europeans | 91.2 /100 | #132 | Exceptional $88,751 |
| Immigrants | Ethiopia | 90.9 /100 | #133 | Exceptional $88,687 |
| Swedes | 90.0 /100 | #134 | Exceptional $88,524 |
| Immigrants | Sierra Leone | 89.9 /100 | #135 | Excellent $88,498 |
| Poles | 89.7 /100 | #136 | Excellent $88,472 |
| Sierra Leoneans | 89.6 /100 | #137 | Excellent $88,463 |
| Arabs | 89.2 /100 | #138 | Excellent $88,398 |
| Immigrants | Chile | 89.2 /100 | #139 | Excellent $88,388 |
| Lebanese | 87.2 /100 | #140 | Excellent $88,091 |
| Immigrants | Morocco | 86.0 /100 | #141 | Excellent $87,930 |