German Russian vs Immigrants from Western Europe Median Earnings
COMPARE
German Russian
Immigrants from Western Europe
Median Earnings
Median Earnings Comparison
German Russians
Immigrants from Western Europe
$43,200
MEDIAN EARNINGS
1.1/ 100
METRIC RATING
259th/ 347
METRIC RANK
$50,549
MEDIAN EARNINGS
99.7/ 100
METRIC RATING
77th/ 347
METRIC RANK
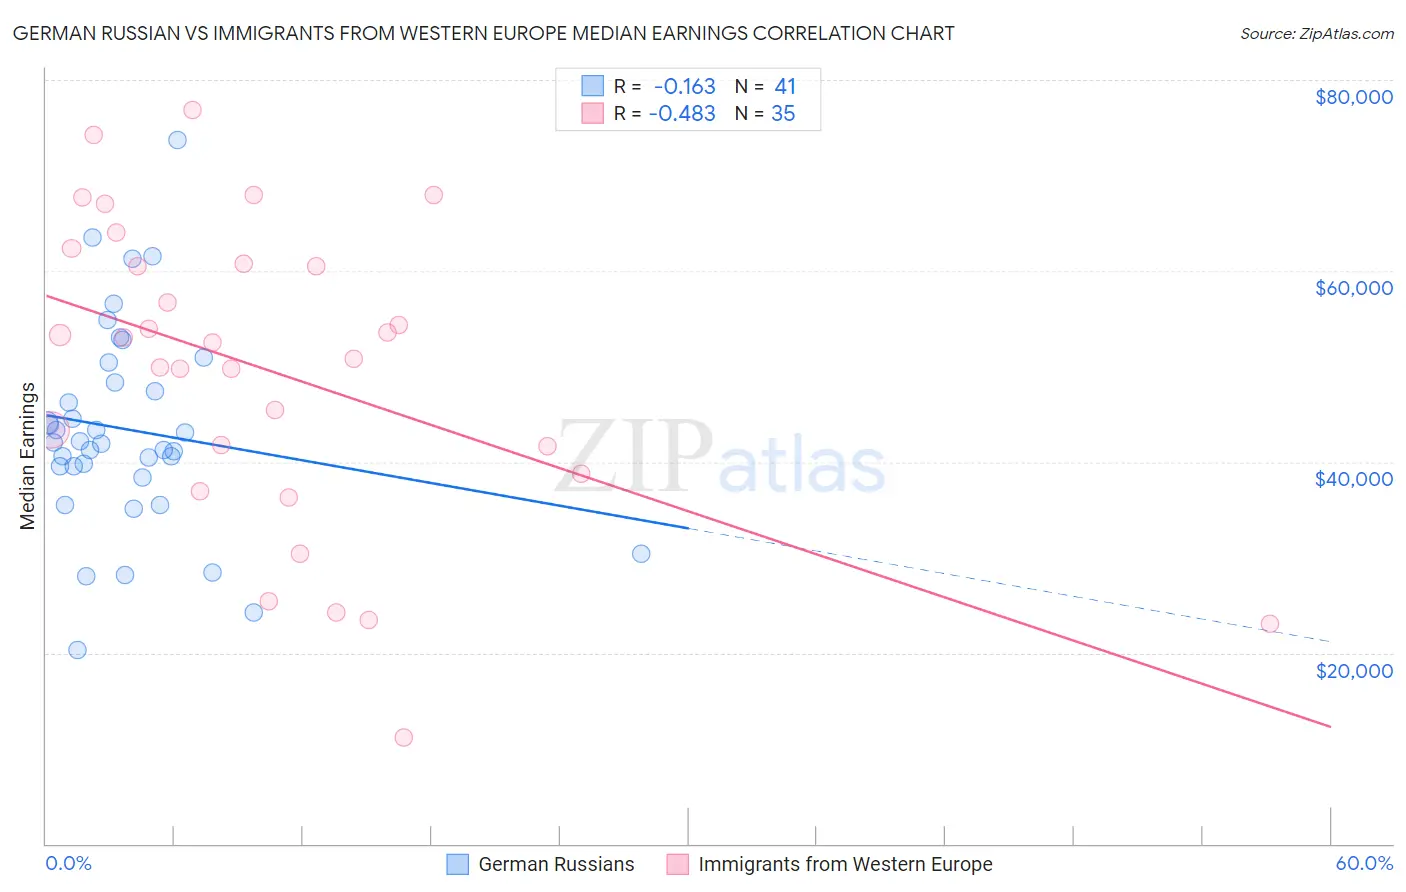
German Russian vs Immigrants from Western Europe Median Earnings Correlation Chart
The statistical analysis conducted on geographies consisting of 96,461,266 people shows a poor negative correlation between the proportion of German Russians and median earnings in the United States with a correlation coefficient (R) of -0.163 and weighted average of $43,200. Similarly, the statistical analysis conducted on geographies consisting of 493,982,841 people shows a moderate negative correlation between the proportion of Immigrants from Western Europe and median earnings in the United States with a correlation coefficient (R) of -0.483 and weighted average of $50,549, a difference of 17.0%.
Median Earnings Correlation Summary
| Measurement | German Russian | Immigrants from Western Europe |
| Minimum | $20,324 | $11,184 |
| Maximum | $73,750 | $76,795 |
| Range | $53,426 | $65,611 |
| Mean | $43,344 | $49,401 |
| Median | $42,036 | $52,565 |
| Interquartile 25% (IQ1) | $38,952 | $38,750 |
| Interquartile 75% (IQ3) | $49,348 | $60,761 |
| Interquartile Range (IQR) | $10,396 | $22,011 |
| Standard Deviation (Sample) | $10,822 | $15,918 |
| Standard Deviation (Population) | $10,689 | $15,689 |
Similar Demographics by Median Earnings
Demographics Similar to German Russians by Median Earnings
In terms of median earnings, the demographic groups most similar to German Russians are Immigrants from Somalia ($43,100, a difference of 0.23%), French American Indian ($43,333, a difference of 0.31%), Jamaican ($43,343, a difference of 0.33%), Immigrants from Jamaica ($43,026, a difference of 0.40%), and Nicaraguan ($43,026, a difference of 0.40%).
| Demographics | Rating | Rank | Median Earnings |
| Hawaiians | 2.0 /100 | #252 | Tragic $43,673 |
| Somalis | 1.8 /100 | #253 | Tragic $43,567 |
| Liberians | 1.7 /100 | #254 | Tragic $43,536 |
| Immigrants | Middle Africa | 1.4 /100 | #255 | Tragic $43,416 |
| Alaskan Athabascans | 1.4 /100 | #256 | Tragic $43,393 |
| Jamaicans | 1.3 /100 | #257 | Tragic $43,343 |
| French American Indians | 1.3 /100 | #258 | Tragic $43,333 |
| German Russians | 1.1 /100 | #259 | Tragic $43,200 |
| Immigrants | Somalia | 0.9 /100 | #260 | Tragic $43,100 |
| Immigrants | Jamaica | 0.8 /100 | #261 | Tragic $43,026 |
| Nicaraguans | 0.8 /100 | #262 | Tragic $43,026 |
| Inupiat | 0.8 /100 | #263 | Tragic $43,000 |
| Immigrants | Liberia | 0.7 /100 | #264 | Tragic $42,923 |
| Salvadorans | 0.7 /100 | #265 | Tragic $42,912 |
| Immigrants | Laos | 0.7 /100 | #266 | Tragic $42,884 |
Demographics Similar to Immigrants from Western Europe by Median Earnings
In terms of median earnings, the demographic groups most similar to Immigrants from Western Europe are Immigrants from Italy ($50,581, a difference of 0.060%), Argentinean ($50,399, a difference of 0.30%), Immigrants from Scotland ($50,741, a difference of 0.38%), South African ($50,752, a difference of 0.40%), and Laotian ($50,343, a difference of 0.41%).
| Demographics | Rating | Rank | Median Earnings |
| Lithuanians | 99.8 /100 | #70 | Exceptional $50,991 |
| Immigrants | Ukraine | 99.8 /100 | #71 | Exceptional $50,984 |
| Immigrants | Egypt | 99.8 /100 | #72 | Exceptional $50,901 |
| Immigrants | Netherlands | 99.8 /100 | #73 | Exceptional $50,818 |
| South Africans | 99.8 /100 | #74 | Exceptional $50,752 |
| Immigrants | Scotland | 99.8 /100 | #75 | Exceptional $50,741 |
| Immigrants | Italy | 99.7 /100 | #76 | Exceptional $50,581 |
| Immigrants | Western Europe | 99.7 /100 | #77 | Exceptional $50,549 |
| Argentineans | 99.6 /100 | #78 | Exceptional $50,399 |
| Laotians | 99.6 /100 | #79 | Exceptional $50,343 |
| Ukrainians | 99.6 /100 | #80 | Exceptional $50,320 |
| Immigrants | Southern Europe | 99.6 /100 | #81 | Exceptional $50,280 |
| Immigrants | Moldova | 99.5 /100 | #82 | Exceptional $50,274 |
| Romanians | 99.5 /100 | #83 | Exceptional $50,244 |
| Immigrants | Hungary | 99.5 /100 | #84 | Exceptional $50,227 |