Immigrants from Venezuela vs Tlingit-Haida Male Disability
COMPARE
Immigrants from Venezuela
Tlingit-Haida
Male Disability
Male Disability Comparison
Immigrants from Venezuela
Tlingit-Haida
10.0%
MALE DISABILITY
100.0/ 100
METRIC RATING
22nd/ 347
METRIC RANK
13.8%
MALE DISABILITY
0.0/ 100
METRIC RATING
320th/ 347
METRIC RANK
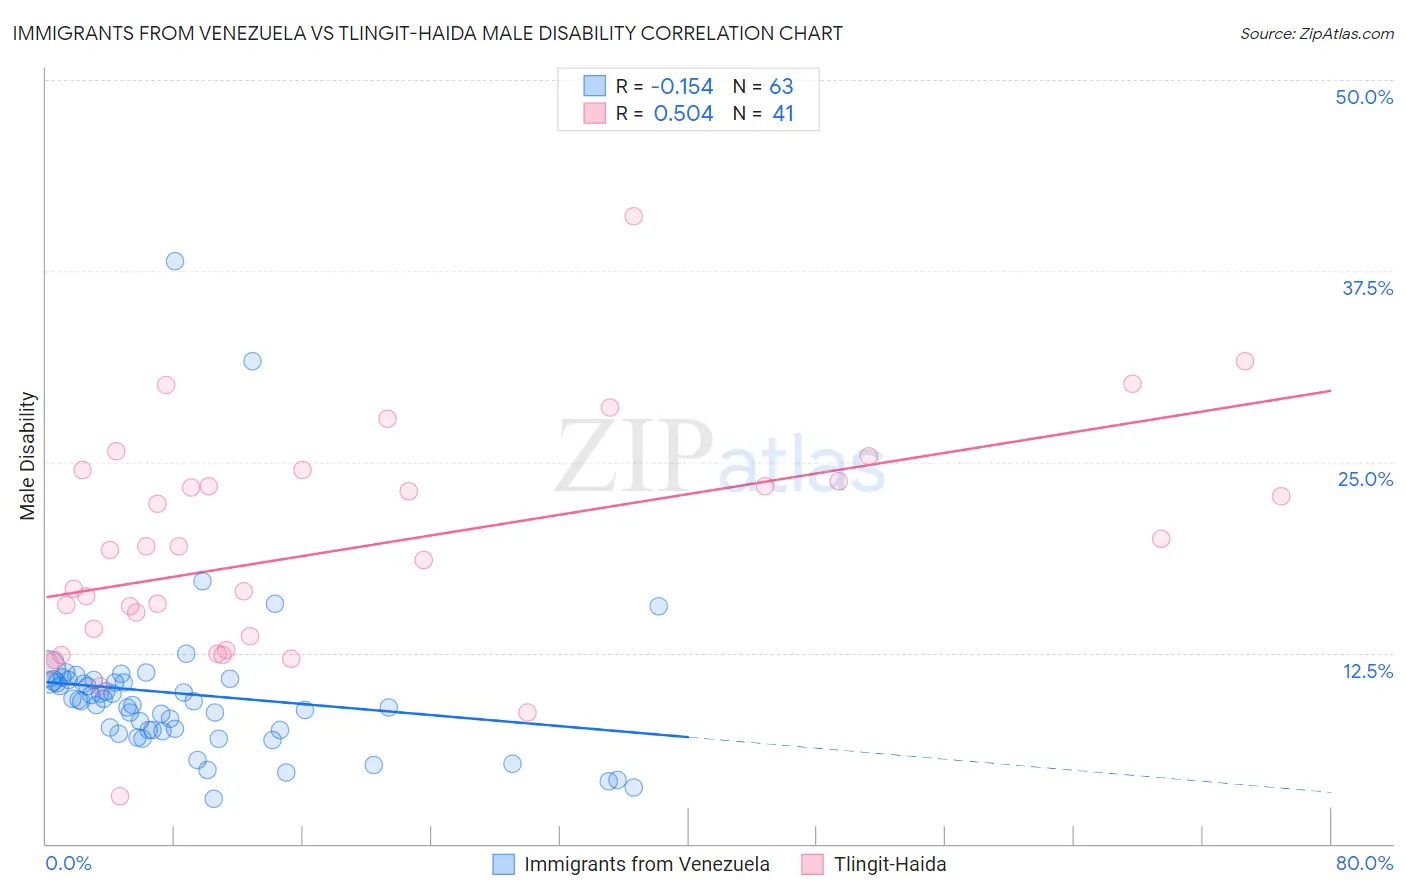
Immigrants from Venezuela vs Tlingit-Haida Male Disability Correlation Chart
The statistical analysis conducted on geographies consisting of 287,855,210 people shows a poor negative correlation between the proportion of Immigrants from Venezuela and percentage of males with a disability in the United States with a correlation coefficient (R) of -0.154 and weighted average of 10.0%. Similarly, the statistical analysis conducted on geographies consisting of 60,851,832 people shows a substantial positive correlation between the proportion of Tlingit-Haida and percentage of males with a disability in the United States with a correlation coefficient (R) of 0.504 and weighted average of 13.8%, a difference of 38.3%.
Male Disability Correlation Summary
| Measurement | Immigrants from Venezuela | Tlingit-Haida |
| Minimum | 2.9% | 3.1% |
| Maximum | 38.1% | 41.1% |
| Range | 35.2% | 38.0% |
| Mean | 9.8% | 19.4% |
| Median | 9.3% | 19.2% |
| Interquartile 25% (IQ1) | 7.4% | 13.1% |
| Interquartile 75% (IQ3) | 10.7% | 24.1% |
| Interquartile Range (IQR) | 3.2% | 11.0% |
| Standard Deviation (Sample) | 5.3% | 7.4% |
| Standard Deviation (Population) | 5.3% | 7.3% |
Similar Demographics by Male Disability
Demographics Similar to Immigrants from Venezuela by Male Disability
In terms of male disability, the demographic groups most similar to Immigrants from Venezuela are Cypriot (10.0%, a difference of 0.090%), Immigrants from Asia (10.0%, a difference of 0.23%), Burmese (10.0%, a difference of 0.29%), Asian (10.0%, a difference of 0.39%), and Immigrants from Malaysia (10.0%, a difference of 0.41%).
| Demographics | Rating | Rank | Male Disability |
| Indians (Asian) | 100.0 /100 | #15 | Exceptional 9.7% |
| Okinawans | 100.0 /100 | #16 | Exceptional 9.8% |
| Immigrants | Korea | 100.0 /100 | #17 | Exceptional 9.8% |
| Immigrants | Pakistan | 100.0 /100 | #18 | Exceptional 9.8% |
| Immigrants | Sri Lanka | 100.0 /100 | #19 | Exceptional 10.0% |
| Asians | 100.0 /100 | #20 | Exceptional 10.0% |
| Burmese | 100.0 /100 | #21 | Exceptional 10.0% |
| Immigrants | Venezuela | 100.0 /100 | #22 | Exceptional 10.0% |
| Cypriots | 100.0 /100 | #23 | Exceptional 10.0% |
| Immigrants | Asia | 100.0 /100 | #24 | Exceptional 10.0% |
| Immigrants | Malaysia | 99.9 /100 | #25 | Exceptional 10.0% |
| Paraguayans | 99.9 /100 | #26 | Exceptional 10.1% |
| Egyptians | 99.9 /100 | #27 | Exceptional 10.1% |
| Vietnamese | 99.9 /100 | #28 | Exceptional 10.1% |
| Venezuelans | 99.9 /100 | #29 | Exceptional 10.1% |
Demographics Similar to Tlingit-Haida by Male Disability
In terms of male disability, the demographic groups most similar to Tlingit-Haida are Shoshone (13.8%, a difference of 0.050%), American (13.8%, a difference of 0.49%), Cree (13.7%, a difference of 0.90%), Paiute (13.7%, a difference of 1.1%), and Apache (14.0%, a difference of 1.2%).
| Demographics | Rating | Rank | Male Disability |
| Puget Sound Salish | 0.0 /100 | #313 | Tragic 13.5% |
| Aleuts | 0.0 /100 | #314 | Tragic 13.5% |
| Iroquois | 0.0 /100 | #315 | Tragic 13.6% |
| Alaska Natives | 0.0 /100 | #316 | Tragic 13.6% |
| Paiute | 0.0 /100 | #317 | Tragic 13.7% |
| Cree | 0.0 /100 | #318 | Tragic 13.7% |
| Americans | 0.0 /100 | #319 | Tragic 13.8% |
| Tlingit-Haida | 0.0 /100 | #320 | Tragic 13.8% |
| Shoshone | 0.0 /100 | #321 | Tragic 13.8% |
| Apache | 0.0 /100 | #322 | Tragic 14.0% |
| Osage | 0.0 /100 | #323 | Tragic 14.0% |
| Comanche | 0.0 /100 | #324 | Tragic 14.1% |
| Ottawa | 0.0 /100 | #325 | Tragic 14.1% |
| Natives/Alaskans | 0.0 /100 | #326 | Tragic 14.2% |
| Potawatomi | 0.0 /100 | #327 | Tragic 14.2% |