Immigrants from Venezuela vs Immigrants from Israel Wage/Income Gap
COMPARE
Immigrants from Venezuela
Immigrants from Israel
Wage/Income Gap
Wage/Income Gap Comparison
Immigrants from Venezuela
Immigrants from Israel
26.2%
WAGE/INCOME GAP
24.7/ 100
METRIC RATING
191st/ 347
METRIC RANK
28.2%
WAGE/INCOME GAP
0.3/ 100
METRIC RATING
293rd/ 347
METRIC RANK
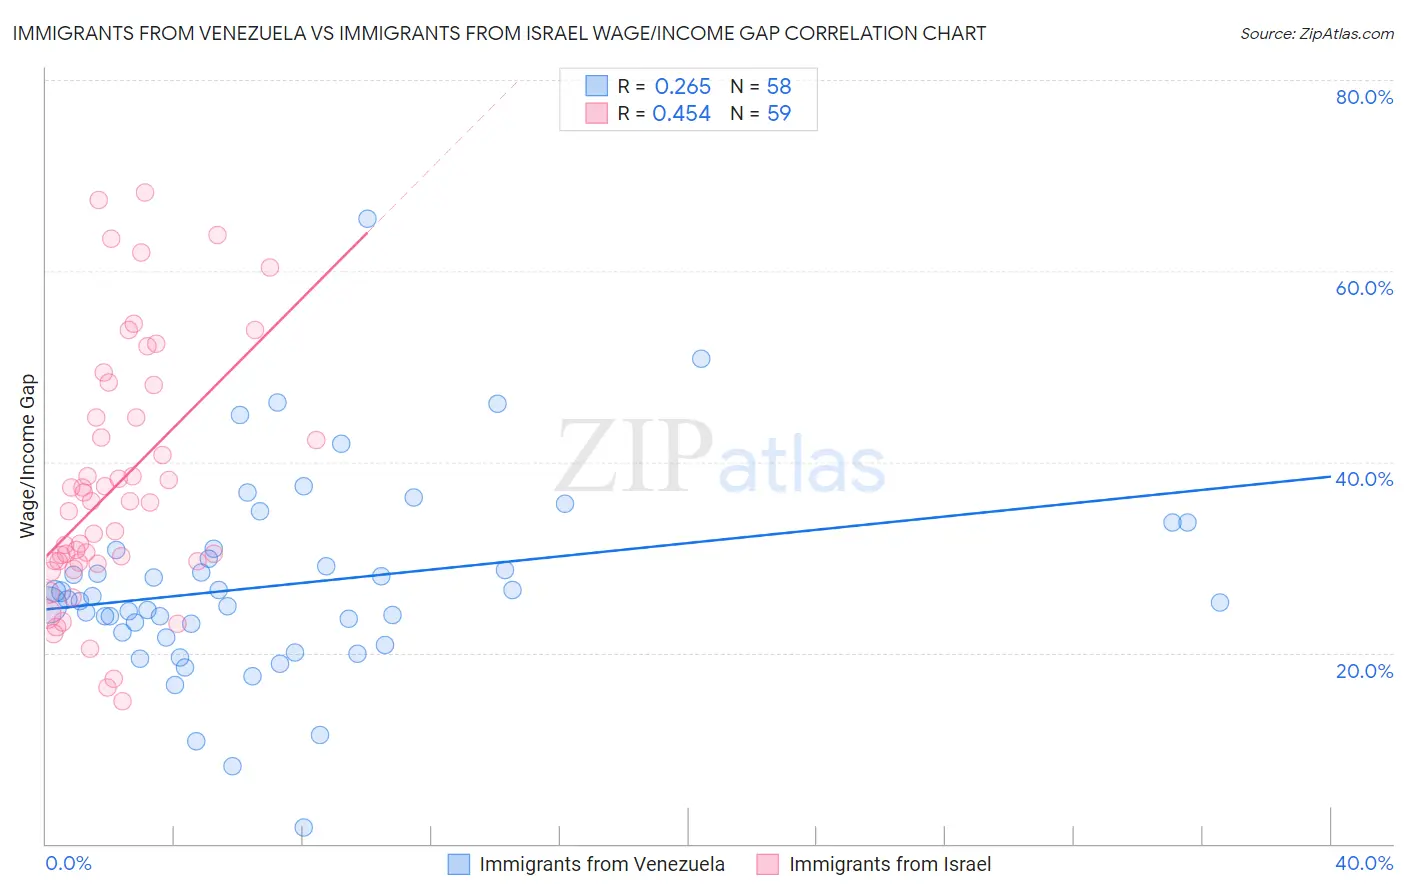
Immigrants from Venezuela vs Immigrants from Israel Wage/Income Gap Correlation Chart
The statistical analysis conducted on geographies consisting of 287,795,884 people shows a weak positive correlation between the proportion of Immigrants from Venezuela and wage/income gap percentage in the United States with a correlation coefficient (R) of 0.265 and weighted average of 26.2%. Similarly, the statistical analysis conducted on geographies consisting of 209,965,459 people shows a moderate positive correlation between the proportion of Immigrants from Israel and wage/income gap percentage in the United States with a correlation coefficient (R) of 0.454 and weighted average of 28.2%, a difference of 7.6%.
Wage/Income Gap Correlation Summary
| Measurement | Immigrants from Venezuela | Immigrants from Israel |
| Minimum | 1.7% | 15.0% |
| Maximum | 65.5% | 68.2% |
| Range | 63.8% | 53.2% |
| Mean | 27.2% | 37.4% |
| Median | 25.5% | 35.8% |
| Interquartile 25% (IQ1) | 22.1% | 29.5% |
| Interquartile 75% (IQ3) | 30.8% | 44.7% |
| Interquartile Range (IQR) | 8.6% | 15.2% |
| Standard Deviation (Sample) | 10.4% | 13.1% |
| Standard Deviation (Population) | 10.3% | 13.0% |
Similar Demographics by Wage/Income Gap
Demographics Similar to Immigrants from Venezuela by Wage/Income Gap
In terms of wage/income gap, the demographic groups most similar to Immigrants from Venezuela are Immigrants from Croatia (26.2%, a difference of 0.020%), Immigrants from Moldova (26.2%, a difference of 0.17%), Immigrants from Bulgaria (26.3%, a difference of 0.19%), Immigrants from Jordan (26.3%, a difference of 0.20%), and Chilean (26.3%, a difference of 0.21%).
| Demographics | Rating | Rank | Wage/Income Gap |
| Mexicans | 34.4 /100 | #184 | Fair 26.0% |
| Pakistanis | 33.7 /100 | #185 | Fair 26.1% |
| Immigrants | Indonesia | 32.5 /100 | #186 | Fair 26.1% |
| Palestinians | 29.9 /100 | #187 | Fair 26.1% |
| Immigrants | Egypt | 29.9 /100 | #188 | Fair 26.1% |
| Immigrants | Moldova | 26.6 /100 | #189 | Fair 26.2% |
| Immigrants | Croatia | 24.8 /100 | #190 | Fair 26.2% |
| Immigrants | Venezuela | 24.7 /100 | #191 | Fair 26.2% |
| Immigrants | Bulgaria | 22.5 /100 | #192 | Fair 26.3% |
| Immigrants | Jordan | 22.4 /100 | #193 | Fair 26.3% |
| Chileans | 22.3 /100 | #194 | Fair 26.3% |
| Immigrants | Malaysia | 22.2 /100 | #195 | Fair 26.3% |
| Immigrants | Western Asia | 21.7 /100 | #196 | Fair 26.3% |
| Zimbabweans | 21.6 /100 | #197 | Fair 26.3% |
| Venezuelans | 21.5 /100 | #198 | Fair 26.3% |
Demographics Similar to Immigrants from Israel by Wage/Income Gap
In terms of wage/income gap, the demographic groups most similar to Immigrants from Israel are Greek (28.2%, a difference of 0.020%), Immigrants from Australia (28.2%, a difference of 0.11%), Slovene (28.3%, a difference of 0.15%), Czechoslovakian (28.2%, a difference of 0.16%), and Northern European (28.3%, a difference of 0.16%).
| Demographics | Rating | Rank | Wage/Income Gap |
| Immigrants | Austria | 0.4 /100 | #286 | Tragic 28.1% |
| Okinawans | 0.4 /100 | #287 | Tragic 28.1% |
| Choctaw | 0.4 /100 | #288 | Tragic 28.1% |
| Canadians | 0.3 /100 | #289 | Tragic 28.1% |
| Australians | 0.3 /100 | #290 | Tragic 28.2% |
| Czechoslovakians | 0.3 /100 | #291 | Tragic 28.2% |
| Immigrants | Australia | 0.3 /100 | #292 | Tragic 28.2% |
| Immigrants | Israel | 0.3 /100 | #293 | Tragic 28.2% |
| Greeks | 0.3 /100 | #294 | Tragic 28.2% |
| Slovenes | 0.3 /100 | #295 | Tragic 28.3% |
| Northern Europeans | 0.3 /100 | #296 | Tragic 28.3% |
| Immigrants | North America | 0.2 /100 | #297 | Tragic 28.4% |
| Austrians | 0.2 /100 | #298 | Tragic 28.4% |
| Immigrants | North Macedonia | 0.2 /100 | #299 | Tragic 28.4% |
| Immigrants | Northern Europe | 0.2 /100 | #300 | Tragic 28.5% |