Immigrants from Uzbekistan vs Puerto Rican Householder Income Under 25 years
COMPARE
Immigrants from Uzbekistan
Puerto Rican
Householder Income Under 25 years
Householder Income Under 25 years Comparison
Immigrants from Uzbekistan
Puerto Ricans
$54,846
HOUSEHOLDER INCOME UNDER 25 YEARS
99.8/ 100
METRIC RATING
62nd/ 347
METRIC RANK
$39,726
HOUSEHOLDER INCOME UNDER 25 YEARS
0.0/ 100
METRIC RATING
346th/ 347
METRIC RANK
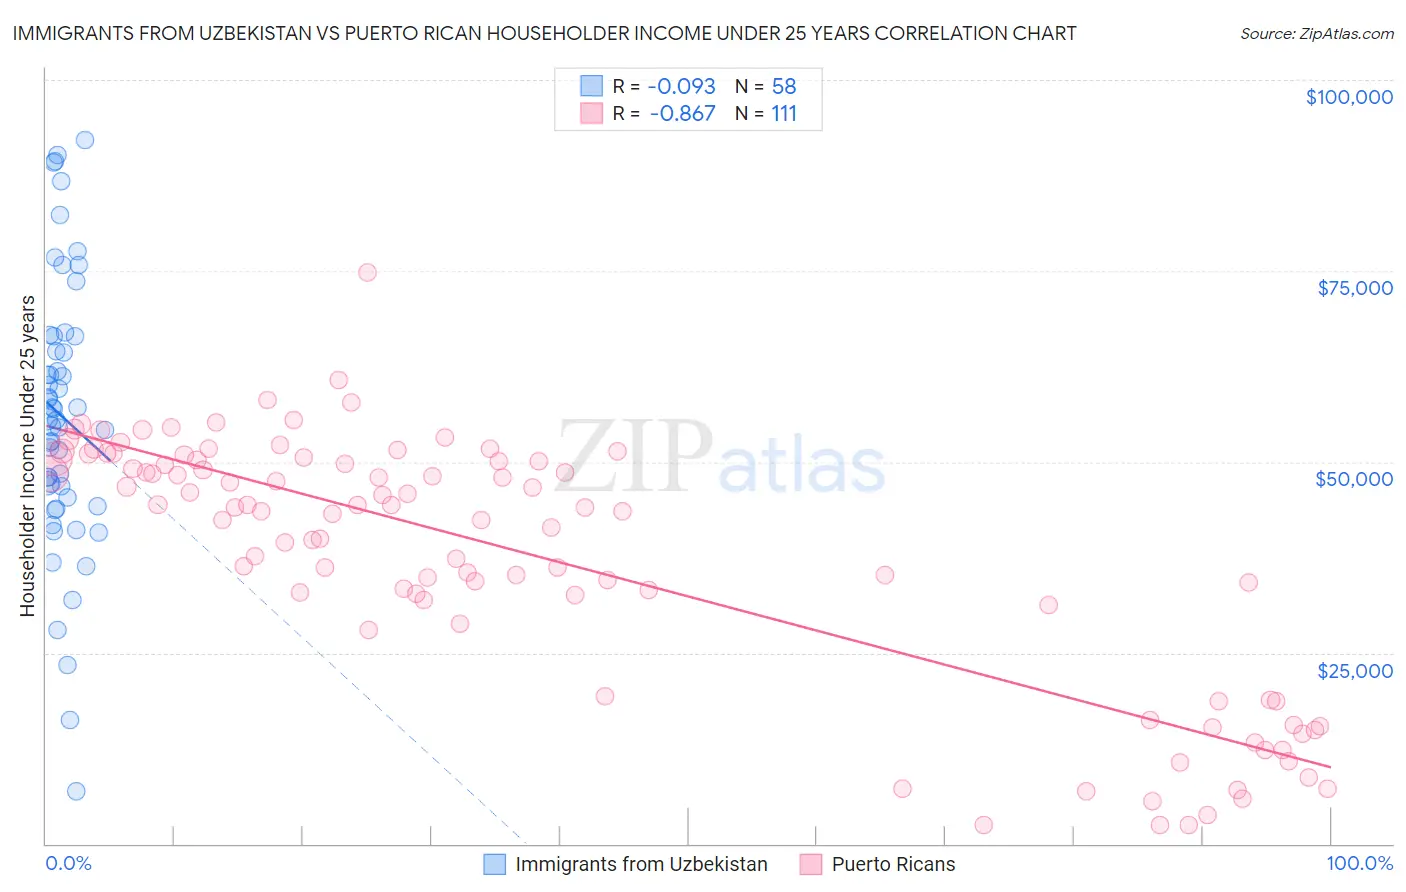
Immigrants from Uzbekistan vs Puerto Rican Householder Income Under 25 years Correlation Chart
The statistical analysis conducted on geographies consisting of 107,079,735 people shows a slight negative correlation between the proportion of Immigrants from Uzbekistan and household income with householder under the age of 25 in the United States with a correlation coefficient (R) of -0.093 and weighted average of $54,846. Similarly, the statistical analysis conducted on geographies consisting of 421,445,593 people shows a very strong negative correlation between the proportion of Puerto Ricans and household income with householder under the age of 25 in the United States with a correlation coefficient (R) of -0.867 and weighted average of $39,726, a difference of 38.1%.
Householder Income Under 25 years Correlation Summary
| Measurement | Immigrants from Uzbekistan | Puerto Rican |
| Minimum | $6,940 | $2,499 |
| Maximum | $92,155 | $74,844 |
| Range | $85,215 | $72,345 |
| Mean | $56,006 | $37,468 |
| Median | $55,551 | $43,546 |
| Interquartile 25% (IQ1) | $45,302 | $28,872 |
| Interquartile 75% (IQ3) | $66,438 | $50,281 |
| Interquartile Range (IQR) | $21,136 | $21,410 |
| Standard Deviation (Sample) | $17,863 | $16,633 |
| Standard Deviation (Population) | $17,708 | $16,558 |
Similar Demographics by Householder Income Under 25 years
Demographics Similar to Immigrants from Uzbekistan by Householder Income Under 25 years
In terms of householder income under 25 years, the demographic groups most similar to Immigrants from Uzbekistan are Immigrants from Belgium ($54,830, a difference of 0.030%), Burmese ($54,800, a difference of 0.080%), Yup'ik ($54,732, a difference of 0.21%), Immigrants from Bangladesh ($54,714, a difference of 0.24%), and Okinawan ($54,701, a difference of 0.26%).
| Demographics | Rating | Rank | Householder Income Under 25 years |
| Immigrants | Ukraine | 100.0 /100 | #55 | Exceptional $55,447 |
| Salvadorans | 100.0 /100 | #56 | Exceptional $55,412 |
| Soviet Union | 100.0 /100 | #57 | Exceptional $55,340 |
| Guyanese | 99.9 /100 | #58 | Exceptional $55,210 |
| Native Hawaiians | 99.9 /100 | #59 | Exceptional $55,158 |
| Immigrants | Lithuania | 99.9 /100 | #60 | Exceptional $55,028 |
| Immigrants | Europe | 99.9 /100 | #61 | Exceptional $55,022 |
| Immigrants | Uzbekistan | 99.8 /100 | #62 | Exceptional $54,846 |
| Immigrants | Belgium | 99.8 /100 | #63 | Exceptional $54,830 |
| Burmese | 99.8 /100 | #64 | Exceptional $54,800 |
| Yup'ik | 99.8 /100 | #65 | Exceptional $54,732 |
| Immigrants | Bangladesh | 99.8 /100 | #66 | Exceptional $54,714 |
| Okinawans | 99.8 /100 | #67 | Exceptional $54,701 |
| Tsimshian | 99.8 /100 | #68 | Exceptional $54,649 |
| Samoans | 99.7 /100 | #69 | Exceptional $54,610 |
Demographics Similar to Puerto Ricans by Householder Income Under 25 years
In terms of householder income under 25 years, the demographic groups most similar to Puerto Ricans are Navajo ($42,380, a difference of 6.7%), Immigrants from Congo ($43,266, a difference of 8.9%), Immigrants from Yemen ($43,591, a difference of 9.7%), Arapaho ($44,003, a difference of 10.8%), and Houma ($44,356, a difference of 11.7%).
| Demographics | Rating | Rank | Householder Income Under 25 years |
| Creek | 0.0 /100 | #333 | Tragic $45,371 |
| Cajuns | 0.0 /100 | #334 | Tragic $45,338 |
| Cheyenne | 0.0 /100 | #335 | Tragic $45,275 |
| Tohono O'odham | 0.0 /100 | #336 | Tragic $45,248 |
| Pueblo | 0.0 /100 | #337 | Tragic $45,018 |
| Chickasaw | 0.0 /100 | #338 | Tragic $44,763 |
| Kiowa | 0.0 /100 | #339 | Tragic $44,733 |
| Blacks/African Americans | 0.0 /100 | #340 | Tragic $44,381 |
| Houma | 0.0 /100 | #341 | Tragic $44,356 |
| Arapaho | 0.0 /100 | #342 | Tragic $44,003 |
| Immigrants | Yemen | 0.0 /100 | #343 | Tragic $43,591 |
| Immigrants | Congo | 0.0 /100 | #344 | Tragic $43,266 |
| Navajo | 0.0 /100 | #345 | Tragic $42,380 |
| Puerto Ricans | 0.0 /100 | #346 | Tragic $39,726 |
| Lumbee | 0.0 /100 | #347 | Tragic $34,584 |