Immigrants from Uzbekistan vs Immigrants from Ecuador Householder Income Under 25 years
COMPARE
Immigrants from Uzbekistan
Immigrants from Ecuador
Householder Income Under 25 years
Householder Income Under 25 years Comparison
Immigrants from Uzbekistan
Immigrants from Ecuador
$54,846
HOUSEHOLDER INCOME UNDER 25 YEARS
99.8/ 100
METRIC RATING
62nd/ 347
METRIC RANK
$53,722
HOUSEHOLDER INCOME UNDER 25 YEARS
97.7/ 100
METRIC RATING
109th/ 347
METRIC RANK
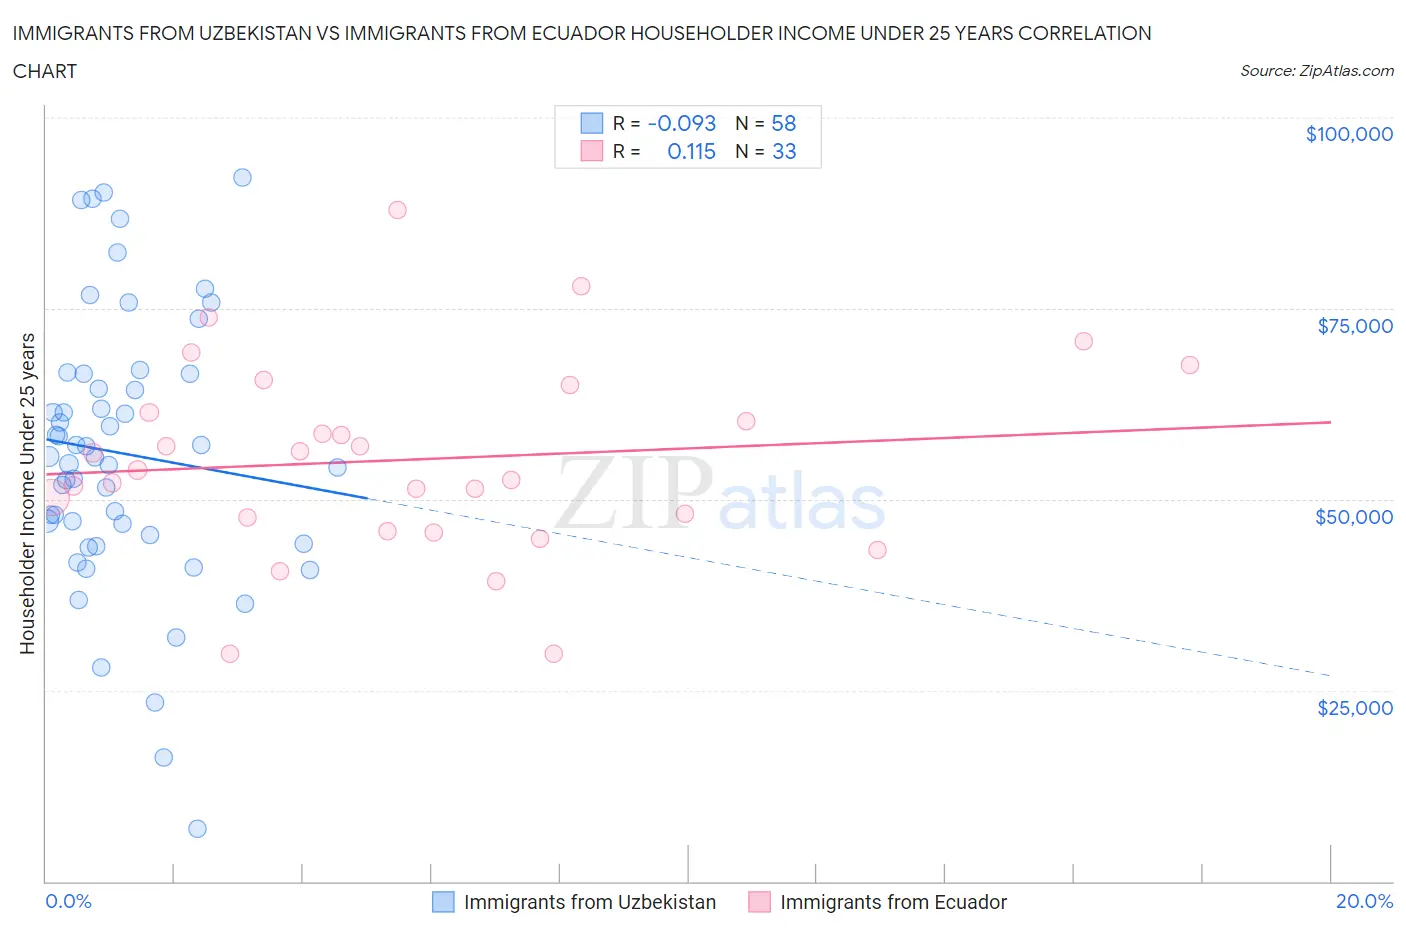
Immigrants from Uzbekistan vs Immigrants from Ecuador Householder Income Under 25 years Correlation Chart
The statistical analysis conducted on geographies consisting of 107,079,735 people shows a slight negative correlation between the proportion of Immigrants from Uzbekistan and household income with householder under the age of 25 in the United States with a correlation coefficient (R) of -0.093 and weighted average of $54,846. Similarly, the statistical analysis conducted on geographies consisting of 234,245,730 people shows a poor positive correlation between the proportion of Immigrants from Ecuador and household income with householder under the age of 25 in the United States with a correlation coefficient (R) of 0.115 and weighted average of $53,722, a difference of 2.1%.
Householder Income Under 25 years Correlation Summary
| Measurement | Immigrants from Uzbekistan | Immigrants from Ecuador |
| Minimum | $6,940 | $29,733 |
| Maximum | $92,155 | $87,926 |
| Range | $85,215 | $58,193 |
| Mean | $56,006 | $55,187 |
| Median | $55,551 | $53,782 |
| Interquartile 25% (IQ1) | $45,302 | $46,779 |
| Interquartile 75% (IQ3) | $66,438 | $63,173 |
| Interquartile Range (IQR) | $21,136 | $16,394 |
| Standard Deviation (Sample) | $17,863 | $12,746 |
| Standard Deviation (Population) | $17,708 | $12,552 |
Similar Demographics by Householder Income Under 25 years
Demographics Similar to Immigrants from Uzbekistan by Householder Income Under 25 years
In terms of householder income under 25 years, the demographic groups most similar to Immigrants from Uzbekistan are Immigrants from Belgium ($54,830, a difference of 0.030%), Burmese ($54,800, a difference of 0.080%), Yup'ik ($54,732, a difference of 0.21%), Immigrants from Bangladesh ($54,714, a difference of 0.24%), and Okinawan ($54,701, a difference of 0.26%).
| Demographics | Rating | Rank | Householder Income Under 25 years |
| Immigrants | Ukraine | 100.0 /100 | #55 | Exceptional $55,447 |
| Salvadorans | 100.0 /100 | #56 | Exceptional $55,412 |
| Soviet Union | 100.0 /100 | #57 | Exceptional $55,340 |
| Guyanese | 99.9 /100 | #58 | Exceptional $55,210 |
| Native Hawaiians | 99.9 /100 | #59 | Exceptional $55,158 |
| Immigrants | Lithuania | 99.9 /100 | #60 | Exceptional $55,028 |
| Immigrants | Europe | 99.9 /100 | #61 | Exceptional $55,022 |
| Immigrants | Uzbekistan | 99.8 /100 | #62 | Exceptional $54,846 |
| Immigrants | Belgium | 99.8 /100 | #63 | Exceptional $54,830 |
| Burmese | 99.8 /100 | #64 | Exceptional $54,800 |
| Yup'ik | 99.8 /100 | #65 | Exceptional $54,732 |
| Immigrants | Bangladesh | 99.8 /100 | #66 | Exceptional $54,714 |
| Okinawans | 99.8 /100 | #67 | Exceptional $54,701 |
| Tsimshian | 99.8 /100 | #68 | Exceptional $54,649 |
| Samoans | 99.7 /100 | #69 | Exceptional $54,610 |
Demographics Similar to Immigrants from Ecuador by Householder Income Under 25 years
In terms of householder income under 25 years, the demographic groups most similar to Immigrants from Ecuador are Greek ($53,715, a difference of 0.010%), Immigrants from Colombia ($53,714, a difference of 0.010%), Maltese ($53,735, a difference of 0.020%), Australian ($53,739, a difference of 0.030%), and Immigrants from Oceania ($53,680, a difference of 0.080%).
| Demographics | Rating | Rank | Householder Income Under 25 years |
| Ecuadorians | 98.5 /100 | #102 | Exceptional $53,911 |
| Ukrainians | 98.3 /100 | #103 | Exceptional $53,843 |
| Ethiopians | 98.2 /100 | #104 | Exceptional $53,818 |
| Immigrants | France | 98.1 /100 | #105 | Exceptional $53,805 |
| Albanians | 98.1 /100 | #106 | Exceptional $53,794 |
| Australians | 97.8 /100 | #107 | Exceptional $53,739 |
| Maltese | 97.8 /100 | #108 | Exceptional $53,735 |
| Immigrants | Ecuador | 97.7 /100 | #109 | Exceptional $53,722 |
| Greeks | 97.7 /100 | #110 | Exceptional $53,715 |
| Immigrants | Colombia | 97.7 /100 | #111 | Exceptional $53,714 |
| Immigrants | Oceania | 97.5 /100 | #112 | Exceptional $53,680 |
| Romanians | 97.2 /100 | #113 | Exceptional $53,632 |
| Immigrants | Sweden | 97.1 /100 | #114 | Exceptional $53,621 |
| Immigrants | Albania | 96.9 /100 | #115 | Exceptional $53,597 |
| Immigrants | Spain | 96.6 /100 | #116 | Exceptional $53,560 |