Immigrants from Uzbekistan vs Luxembourger Householder Income Ages 25 - 44 years
COMPARE
Immigrants from Uzbekistan
Luxembourger
Householder Income Ages 25 - 44 years
Householder Income Ages 25 - 44 years Comparison
Immigrants from Uzbekistan
Luxembourgers
$98,849
HOUSEHOLDER INCOME AGES 25 - 44 YEARS
91.5/ 100
METRIC RATING
122nd/ 347
METRIC RANK
$97,237
HOUSEHOLDER INCOME AGES 25 - 44 YEARS
81.5/ 100
METRIC RATING
141st/ 347
METRIC RANK
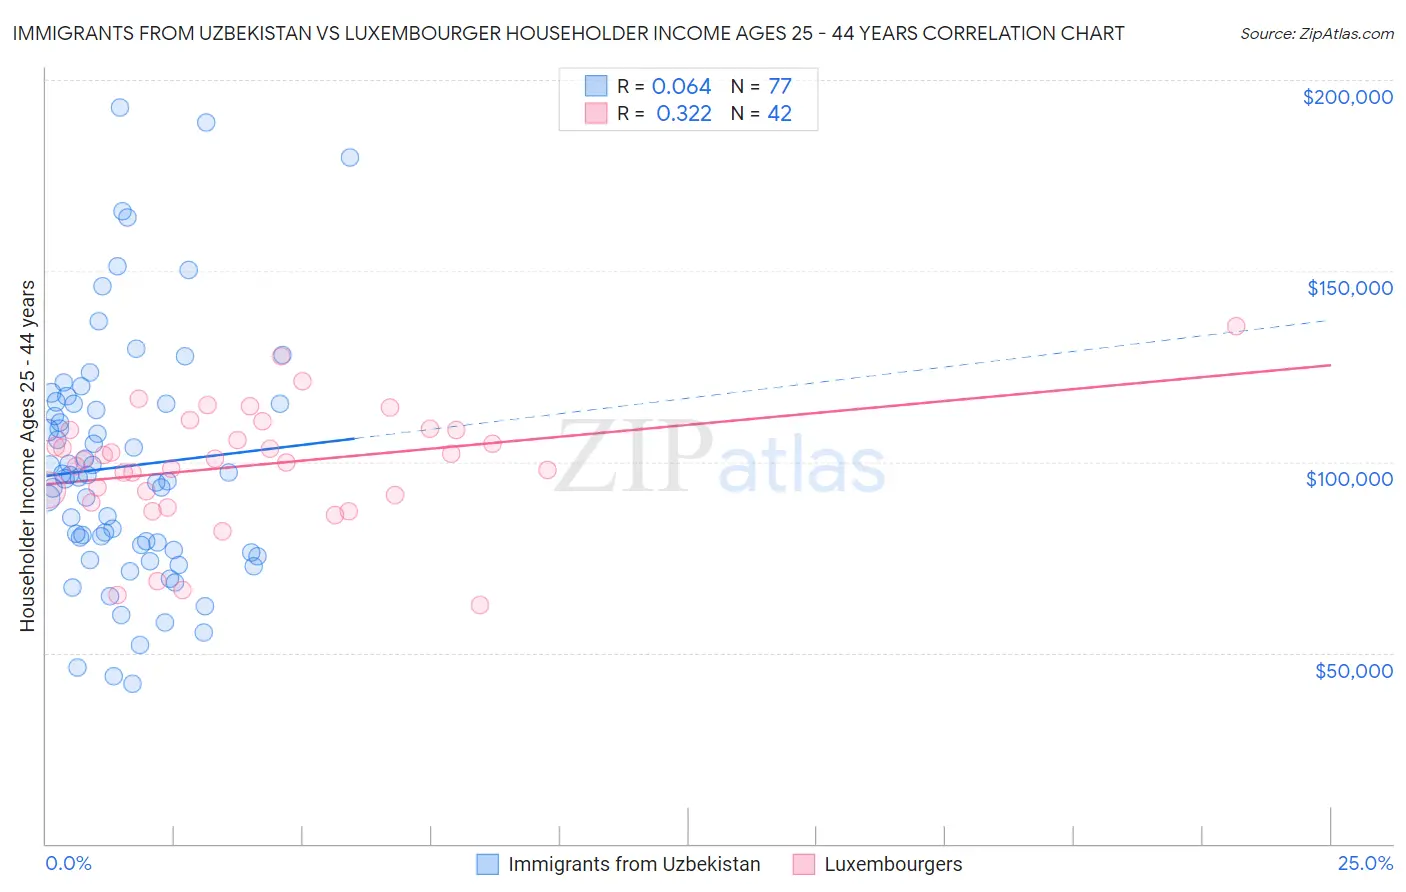
Immigrants from Uzbekistan vs Luxembourger Householder Income Ages 25 - 44 years Correlation Chart
The statistical analysis conducted on geographies consisting of 118,660,152 people shows a slight positive correlation between the proportion of Immigrants from Uzbekistan and household income with householder between the ages 25 and 44 in the United States with a correlation coefficient (R) of 0.064 and weighted average of $98,849. Similarly, the statistical analysis conducted on geographies consisting of 144,399,527 people shows a mild positive correlation between the proportion of Luxembourgers and household income with householder between the ages 25 and 44 in the United States with a correlation coefficient (R) of 0.322 and weighted average of $97,237, a difference of 1.7%.
Householder Income Ages 25 - 44 years Correlation Summary
| Measurement | Immigrants from Uzbekistan | Luxembourger |
| Minimum | $41,890 | $62,500 |
| Maximum | $192,849 | $135,353 |
| Range | $150,959 | $72,853 |
| Mean | $98,791 | $99,089 |
| Median | $95,849 | $100,624 |
| Interquartile 25% (IQ1) | $76,528 | $91,375 |
| Interquartile 75% (IQ3) | $115,337 | $108,286 |
| Interquartile Range (IQR) | $38,808 | $16,911 |
| Standard Deviation (Sample) | $32,098 | $15,610 |
| Standard Deviation (Population) | $31,889 | $15,424 |
Demographics Similar to Immigrants from Uzbekistan and Luxembourgers by Householder Income Ages 25 - 44 years
In terms of householder income ages 25 - 44 years, the demographic groups most similar to Immigrants from Uzbekistan are Peruvian ($98,886, a difference of 0.040%), Palestinian ($98,777, a difference of 0.070%), Zimbabwean ($98,586, a difference of 0.27%), Pakistani ($98,401, a difference of 0.46%), and British ($98,359, a difference of 0.50%). Similarly, the demographic groups most similar to Luxembourgers are Immigrants from Morocco ($97,305, a difference of 0.070%), Immigrants from Peru ($97,329, a difference of 0.090%), Lebanese ($97,339, a difference of 0.10%), Arab ($97,336, a difference of 0.10%), and Hungarian ($97,544, a difference of 0.32%).
| Demographics | Rating | Rank | Householder Income Ages 25 - 44 years |
| Peruvians | 91.7 /100 | #121 | Exceptional $98,886 |
| Immigrants | Uzbekistan | 91.5 /100 | #122 | Exceptional $98,849 |
| Palestinians | 91.2 /100 | #123 | Exceptional $98,777 |
| Zimbabweans | 90.3 /100 | #124 | Exceptional $98,586 |
| Pakistanis | 89.3 /100 | #125 | Excellent $98,401 |
| British | 89.1 /100 | #126 | Excellent $98,359 |
| Serbians | 88.9 /100 | #127 | Excellent $98,320 |
| Europeans | 88.9 /100 | #128 | Excellent $98,310 |
| Brazilians | 88.6 /100 | #129 | Excellent $98,267 |
| Immigrants | Kuwait | 87.8 /100 | #130 | Excellent $98,122 |
| Immigrants | Albania | 86.6 /100 | #131 | Excellent $97,929 |
| Immigrants | Zimbabwe | 86.3 /100 | #132 | Excellent $97,880 |
| Tsimshian | 85.8 /100 | #133 | Excellent $97,809 |
| Canadians | 84.5 /100 | #134 | Excellent $97,625 |
| Immigrants | Oceania | 84.5 /100 | #135 | Excellent $97,623 |
| Hungarians | 83.9 /100 | #136 | Excellent $97,544 |
| Lebanese | 82.3 /100 | #137 | Excellent $97,339 |
| Arabs | 82.3 /100 | #138 | Excellent $97,336 |
| Immigrants | Peru | 82.2 /100 | #139 | Excellent $97,329 |
| Immigrants | Morocco | 82.0 /100 | #140 | Excellent $97,305 |
| Luxembourgers | 81.5 /100 | #141 | Excellent $97,237 |