Immigrants from Uzbekistan vs Scotch-Irish Median Female Earnings
COMPARE
Immigrants from Uzbekistan
Scotch-Irish
Median Female Earnings
Median Female Earnings Comparison
Immigrants from Uzbekistan
Scotch-Irish
$43,363
MEDIAN FEMALE EARNINGS
100.0/ 100
METRIC RATING
50th/ 347
METRIC RANK
$37,383
MEDIAN FEMALE EARNINGS
0.8/ 100
METRIC RATING
259th/ 347
METRIC RANK
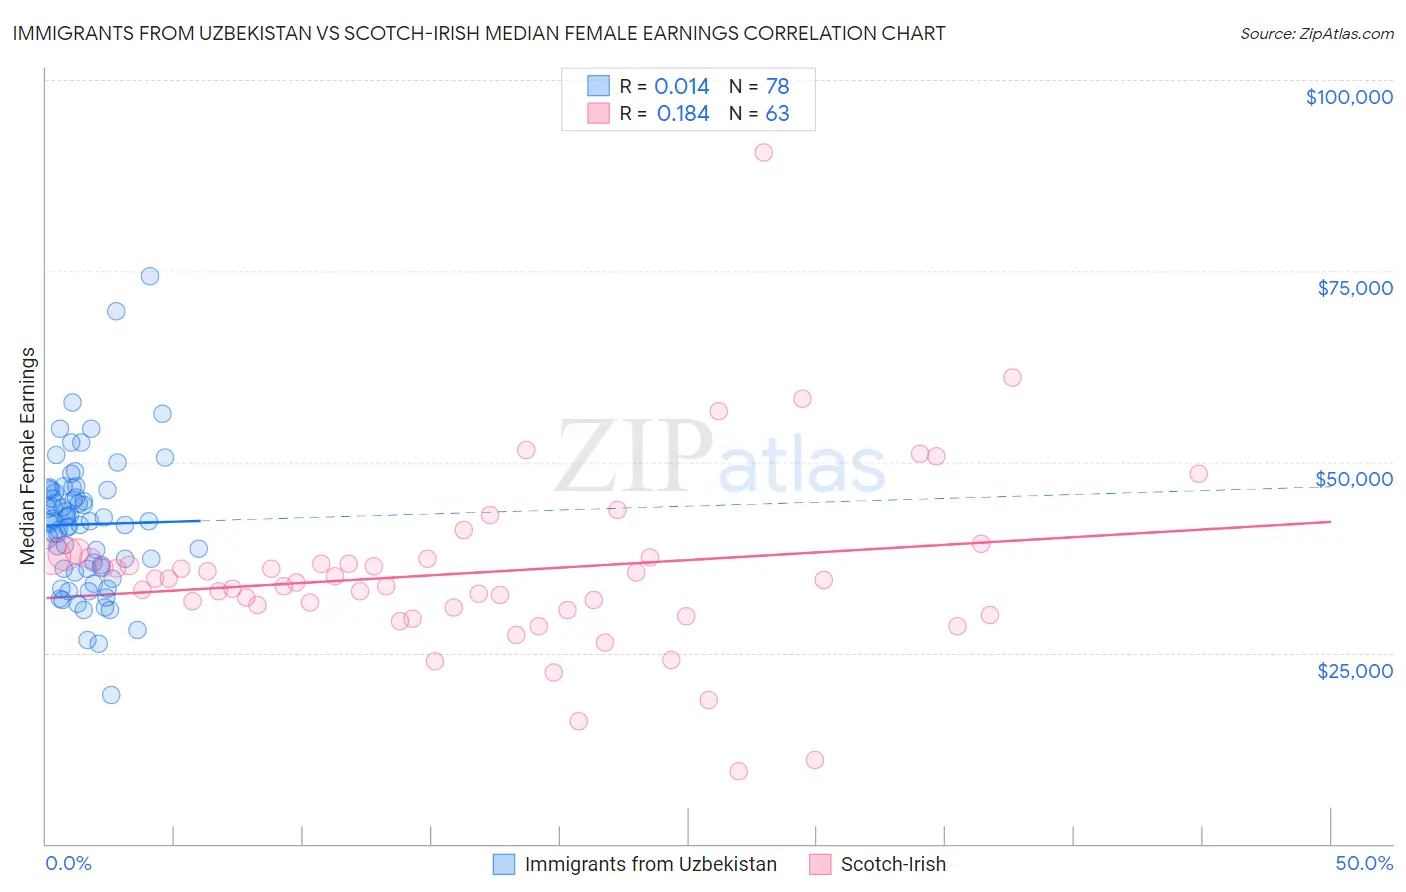
Immigrants from Uzbekistan vs Scotch-Irish Median Female Earnings Correlation Chart
The statistical analysis conducted on geographies consisting of 118,750,050 people shows no correlation between the proportion of Immigrants from Uzbekistan and median female earnings in the United States with a correlation coefficient (R) of 0.014 and weighted average of $43,363. Similarly, the statistical analysis conducted on geographies consisting of 547,379,253 people shows a poor positive correlation between the proportion of Scotch-Irish and median female earnings in the United States with a correlation coefficient (R) of 0.184 and weighted average of $37,383, a difference of 16.0%.
Median Female Earnings Correlation Summary
| Measurement | Immigrants from Uzbekistan | Scotch-Irish |
| Minimum | $19,444 | $9,426 |
| Maximum | $74,375 | $90,469 |
| Range | $54,931 | $81,043 |
| Mean | $41,817 | $35,513 |
| Median | $42,141 | $34,550 |
| Interquartile 25% (IQ1) | $36,088 | $30,536 |
| Interquartile 75% (IQ3) | $46,297 | $37,534 |
| Interquartile Range (IQR) | $10,209 | $6,998 |
| Standard Deviation (Sample) | $8,848 | $11,827 |
| Standard Deviation (Population) | $8,791 | $11,733 |
Similar Demographics by Median Female Earnings
Demographics Similar to Immigrants from Uzbekistan by Median Female Earnings
In terms of median female earnings, the demographic groups most similar to Immigrants from Uzbekistan are Maltese ($43,357, a difference of 0.010%), Immigrants from Serbia ($43,385, a difference of 0.050%), Immigrants from Indonesia ($43,412, a difference of 0.11%), Immigrants from Lithuania ($43,317, a difference of 0.11%), and Immigrants from Eastern Europe ($43,309, a difference of 0.12%).
| Demographics | Rating | Rank | Median Female Earnings |
| Bulgarians | 100.0 /100 | #43 | Exceptional $43,638 |
| Immigrants | Czechoslovakia | 100.0 /100 | #44 | Exceptional $43,571 |
| Immigrants | Europe | 100.0 /100 | #45 | Exceptional $43,523 |
| Immigrants | Bolivia | 100.0 /100 | #46 | Exceptional $43,467 |
| Bolivians | 100.0 /100 | #47 | Exceptional $43,445 |
| Immigrants | Indonesia | 100.0 /100 | #48 | Exceptional $43,412 |
| Immigrants | Serbia | 100.0 /100 | #49 | Exceptional $43,385 |
| Immigrants | Uzbekistan | 100.0 /100 | #50 | Exceptional $43,363 |
| Maltese | 100.0 /100 | #51 | Exceptional $43,357 |
| Immigrants | Lithuania | 99.9 /100 | #52 | Exceptional $43,317 |
| Immigrants | Eastern Europe | 99.9 /100 | #53 | Exceptional $43,309 |
| Australians | 99.9 /100 | #54 | Exceptional $43,308 |
| Egyptians | 99.9 /100 | #55 | Exceptional $43,305 |
| Immigrants | Croatia | 99.9 /100 | #56 | Exceptional $43,258 |
| Ethiopians | 99.9 /100 | #57 | Exceptional $43,243 |
Demographics Similar to Scotch-Irish by Median Female Earnings
In terms of median female earnings, the demographic groups most similar to Scotch-Irish are Belizean ($37,429, a difference of 0.12%), Dutch ($37,339, a difference of 0.12%), Malaysian ($37,298, a difference of 0.23%), Venezuelan ($37,282, a difference of 0.27%), and Samoan ($37,498, a difference of 0.31%).
| Demographics | Rating | Rank | Median Female Earnings |
| Immigrants | Dominica | 2.0 /100 | #252 | Tragic $37,825 |
| Danes | 1.6 /100 | #253 | Tragic $37,730 |
| Whites/Caucasians | 1.1 /100 | #254 | Tragic $37,531 |
| Colville | 1.1 /100 | #255 | Tragic $37,514 |
| Samoans | 1.0 /100 | #256 | Tragic $37,498 |
| Hawaiians | 1.0 /100 | #257 | Tragic $37,497 |
| Belizeans | 0.9 /100 | #258 | Tragic $37,429 |
| Scotch-Irish | 0.8 /100 | #259 | Tragic $37,383 |
| Dutch | 0.7 /100 | #260 | Tragic $37,339 |
| Malaysians | 0.7 /100 | #261 | Tragic $37,298 |
| Venezuelans | 0.7 /100 | #262 | Tragic $37,282 |
| German Russians | 0.5 /100 | #263 | Tragic $37,105 |
| Salvadorans | 0.4 /100 | #264 | Tragic $37,083 |
| Immigrants | Belize | 0.4 /100 | #265 | Tragic $37,056 |
| Dominicans | 0.4 /100 | #266 | Tragic $37,046 |