Immigrants from Ukraine vs Immigrants from Nicaragua Unemployment Among Seniors over 65 years
COMPARE
Immigrants from Ukraine
Immigrants from Nicaragua
Unemployment Among Seniors over 65 years
Unemployment Among Seniors over 65 years Comparison
Immigrants from Ukraine
Immigrants from Nicaragua
5.1%
UNEMPLOYMENT AMONG SENIORS OVER 65 YEARS
64.2/ 100
METRIC RATING
165th/ 347
METRIC RANK
4.9%
UNEMPLOYMENT AMONG SENIORS OVER 65 YEARS
99.6/ 100
METRIC RATING
65th/ 347
METRIC RANK
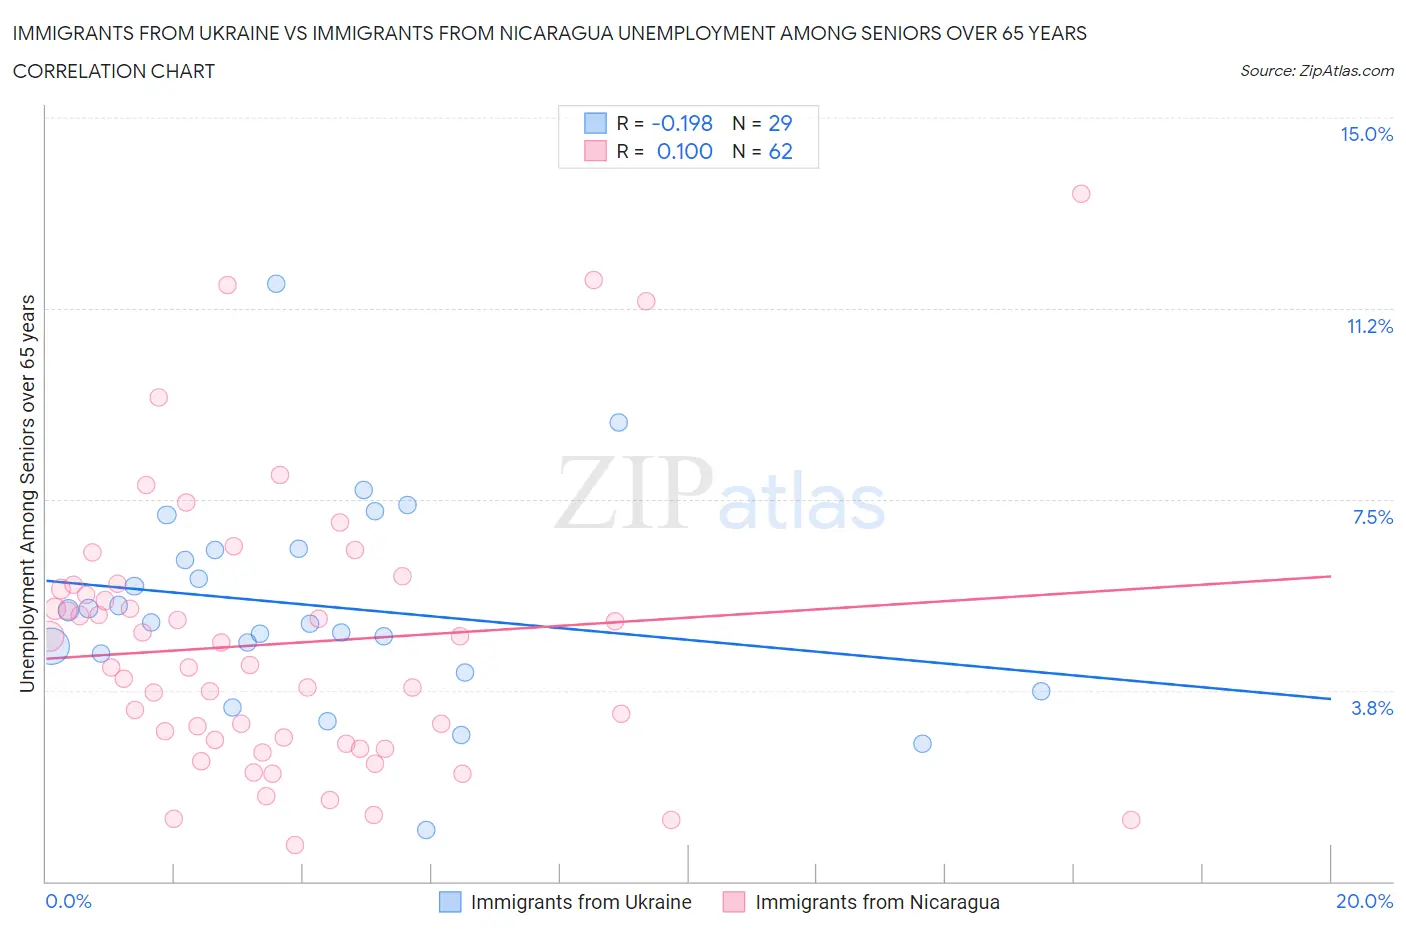
Immigrants from Ukraine vs Immigrants from Nicaragua Unemployment Among Seniors over 65 years Correlation Chart
The statistical analysis conducted on geographies consisting of 269,425,608 people shows a poor negative correlation between the proportion of Immigrants from Ukraine and unemployment rate amomg seniors over the age of 65 in the United States with a correlation coefficient (R) of -0.198 and weighted average of 5.1%. Similarly, the statistical analysis conducted on geographies consisting of 224,099,499 people shows a slight positive correlation between the proportion of Immigrants from Nicaragua and unemployment rate amomg seniors over the age of 65 in the United States with a correlation coefficient (R) of 0.100 and weighted average of 4.9%, a difference of 4.1%.
Unemployment Among Seniors over 65 years Correlation Summary
| Measurement | Immigrants from Ukraine | Immigrants from Nicaragua |
| Minimum | 1.0% | 0.70% |
| Maximum | 11.7% | 13.5% |
| Range | 10.7% | 12.8% |
| Mean | 5.4% | 4.7% |
| Median | 5.1% | 4.2% |
| Interquartile 25% (IQ1) | 4.3% | 2.7% |
| Interquartile 75% (IQ3) | 6.5% | 5.7% |
| Interquartile Range (IQR) | 2.2% | 3.0% |
| Standard Deviation (Sample) | 2.1% | 2.7% |
| Standard Deviation (Population) | 2.1% | 2.7% |
Similar Demographics by Unemployment Among Seniors over 65 years
Demographics Similar to Immigrants from Ukraine by Unemployment Among Seniors over 65 years
In terms of unemployment among seniors over 65 years, the demographic groups most similar to Immigrants from Ukraine are Potawatomi (5.1%, a difference of 0.010%), Nepalese (5.1%, a difference of 0.010%), Immigrants from Laos (5.1%, a difference of 0.010%), Immigrants from South Eastern Asia (5.1%, a difference of 0.050%), and Immigrants from Bosnia and Herzegovina (5.1%, a difference of 0.070%).
| Demographics | Rating | Rank | Unemployment Among Seniors over 65 years |
| Immigrants | Belarus | 69.0 /100 | #158 | Good 5.1% |
| Immigrants | France | 68.6 /100 | #159 | Good 5.1% |
| French | 68.1 /100 | #160 | Good 5.1% |
| Immigrants | Bosnia and Herzegovina | 66.1 /100 | #161 | Good 5.1% |
| Immigrants | South Eastern Asia | 65.6 /100 | #162 | Good 5.1% |
| Potawatomi | 64.5 /100 | #163 | Good 5.1% |
| Nepalese | 64.5 /100 | #164 | Good 5.1% |
| Immigrants | Ukraine | 64.2 /100 | #165 | Good 5.1% |
| Immigrants | Laos | 63.8 /100 | #166 | Good 5.1% |
| Immigrants | Western Europe | 60.4 /100 | #167 | Good 5.1% |
| Mongolians | 59.8 /100 | #168 | Average 5.1% |
| Lithuanians | 58.2 /100 | #169 | Average 5.1% |
| Immigrants | Eastern Asia | 54.9 /100 | #170 | Average 5.1% |
| Immigrants | Nonimmigrants | 54.1 /100 | #171 | Average 5.1% |
| Immigrants | Ireland | 53.2 /100 | #172 | Average 5.1% |
Demographics Similar to Immigrants from Nicaragua by Unemployment Among Seniors over 65 years
In terms of unemployment among seniors over 65 years, the demographic groups most similar to Immigrants from Nicaragua are English (4.9%, a difference of 0.050%), Iroquois (4.9%, a difference of 0.070%), Immigrants from Cambodia (4.9%, a difference of 0.080%), Croatian (4.9%, a difference of 0.090%), and Latvian (4.9%, a difference of 0.10%).
| Demographics | Rating | Rank | Unemployment Among Seniors over 65 years |
| Scandinavians | 99.8 /100 | #58 | Exceptional 4.9% |
| Immigrants | Eastern Africa | 99.7 /100 | #59 | Exceptional 4.9% |
| Immigrants | Middle Africa | 99.7 /100 | #60 | Exceptional 4.9% |
| Northern Europeans | 99.7 /100 | #61 | Exceptional 4.9% |
| Latvians | 99.6 /100 | #62 | Exceptional 4.9% |
| Croatians | 99.6 /100 | #63 | Exceptional 4.9% |
| Immigrants | Cambodia | 99.6 /100 | #64 | Exceptional 4.9% |
| Immigrants | Nicaragua | 99.6 /100 | #65 | Exceptional 4.9% |
| English | 99.5 /100 | #66 | Exceptional 4.9% |
| Iroquois | 99.5 /100 | #67 | Exceptional 4.9% |
| Bolivians | 99.5 /100 | #68 | Exceptional 4.9% |
| Scottish | 99.5 /100 | #69 | Exceptional 4.9% |
| Immigrants | Kazakhstan | 99.4 /100 | #70 | Exceptional 4.9% |
| Immigrants | Moldova | 99.4 /100 | #71 | Exceptional 4.9% |
| Nicaraguans | 99.3 /100 | #72 | Exceptional 4.9% |