Immigrants from Turkey vs Immigrants from Eastern Asia Bachelor's Degree
COMPARE
Immigrants from Turkey
Immigrants from Eastern Asia
Bachelor's Degree
Bachelor's Degree Comparison
Immigrants from Turkey
Immigrants from Eastern Asia
46.0%
BACHELOR'S DEGREE
100.0/ 100
METRIC RATING
32nd/ 347
METRIC RANK
48.1%
BACHELOR'S DEGREE
100.0/ 100
METRIC RATING
15th/ 347
METRIC RANK
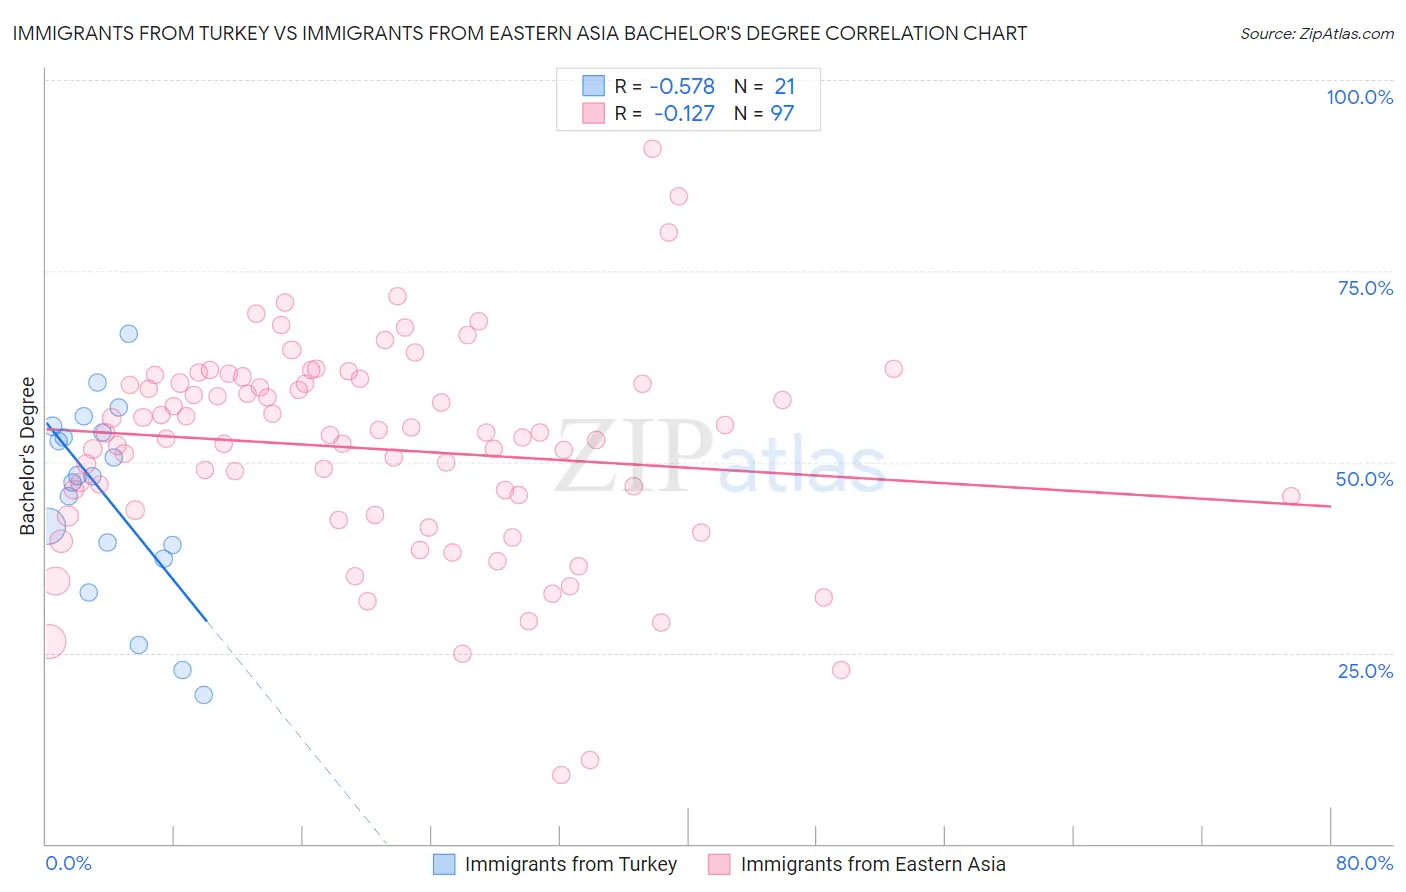
Immigrants from Turkey vs Immigrants from Eastern Asia Bachelor's Degree Correlation Chart
The statistical analysis conducted on geographies consisting of 223,053,231 people shows a substantial negative correlation between the proportion of Immigrants from Turkey and percentage of population with at least bachelor's degree education in the United States with a correlation coefficient (R) of -0.578 and weighted average of 46.0%. Similarly, the statistical analysis conducted on geographies consisting of 499,849,194 people shows a poor negative correlation between the proportion of Immigrants from Eastern Asia and percentage of population with at least bachelor's degree education in the United States with a correlation coefficient (R) of -0.127 and weighted average of 48.1%, a difference of 4.8%.
Bachelor's Degree Correlation Summary
| Measurement | Immigrants from Turkey | Immigrants from Eastern Asia |
| Minimum | 19.5% | 9.0% |
| Maximum | 66.8% | 91.0% |
| Range | 47.3% | 81.9% |
| Mean | 45.4% | 51.7% |
| Median | 48.1% | 53.6% |
| Interquartile 25% (IQ1) | 38.2% | 43.4% |
| Interquartile 75% (IQ3) | 54.2% | 60.3% |
| Interquartile Range (IQR) | 16.0% | 16.9% |
| Standard Deviation (Sample) | 12.5% | 13.9% |
| Standard Deviation (Population) | 12.2% | 13.8% |
Demographics Similar to Immigrants from Turkey and Immigrants from Eastern Asia by Bachelor's Degree
In terms of bachelor's degree, the demographic groups most similar to Immigrants from Turkey are Latvian (46.1%, a difference of 0.30%), Immigrants from Sri Lanka (46.1%, a difference of 0.34%), Israeli (46.1%, a difference of 0.39%), Turkish (46.2%, a difference of 0.52%), and Immigrants from Northern Europe (45.6%, a difference of 0.70%). Similarly, the demographic groups most similar to Immigrants from Eastern Asia are Immigrants from Hong Kong (48.2%, a difference of 0.14%), Immigrants from South Central Asia (48.3%, a difference of 0.42%), Soviet Union (47.9%, a difference of 0.46%), Eastern European (47.5%, a difference of 1.3%), and Indian (Asian) (47.4%, a difference of 1.5%).
| Demographics | Rating | Rank | Bachelor's Degree |
| Immigrants | South Central Asia | 100.0 /100 | #13 | Exceptional 48.3% |
| Immigrants | Hong Kong | 100.0 /100 | #14 | Exceptional 48.2% |
| Immigrants | Eastern Asia | 100.0 /100 | #15 | Exceptional 48.1% |
| Soviet Union | 100.0 /100 | #16 | Exceptional 47.9% |
| Eastern Europeans | 100.0 /100 | #17 | Exceptional 47.5% |
| Indians (Asian) | 100.0 /100 | #18 | Exceptional 47.4% |
| Cambodians | 100.0 /100 | #19 | Exceptional 47.2% |
| Immigrants | Switzerland | 100.0 /100 | #20 | Exceptional 47.1% |
| Immigrants | Ireland | 100.0 /100 | #21 | Exceptional 47.1% |
| Immigrants | Belgium | 100.0 /100 | #22 | Exceptional 47.0% |
| Immigrants | Sweden | 100.0 /100 | #23 | Exceptional 47.0% |
| Immigrants | Korea | 100.0 /100 | #24 | Exceptional 47.0% |
| Burmese | 100.0 /100 | #25 | Exceptional 46.9% |
| Immigrants | Japan | 100.0 /100 | #26 | Exceptional 46.8% |
| Immigrants | France | 100.0 /100 | #27 | Exceptional 46.4% |
| Turks | 100.0 /100 | #28 | Exceptional 46.2% |
| Israelis | 100.0 /100 | #29 | Exceptional 46.1% |
| Immigrants | Sri Lanka | 100.0 /100 | #30 | Exceptional 46.1% |
| Latvians | 100.0 /100 | #31 | Exceptional 46.1% |
| Immigrants | Turkey | 100.0 /100 | #32 | Exceptional 46.0% |
| Immigrants | Northern Europe | 100.0 /100 | #33 | Exceptional 45.6% |