Immigrants from Trinidad and Tobago vs Native/Alaskan Median Female Earnings
COMPARE
Immigrants from Trinidad and Tobago
Native/Alaskan
Median Female Earnings
Median Female Earnings Comparison
Immigrants from Trinidad and Tobago
Natives/Alaskans
$40,895
MEDIAN FEMALE EARNINGS
92.3/ 100
METRIC RATING
126th/ 347
METRIC RANK
$33,806
MEDIAN FEMALE EARNINGS
0.0/ 100
METRIC RATING
331st/ 347
METRIC RANK
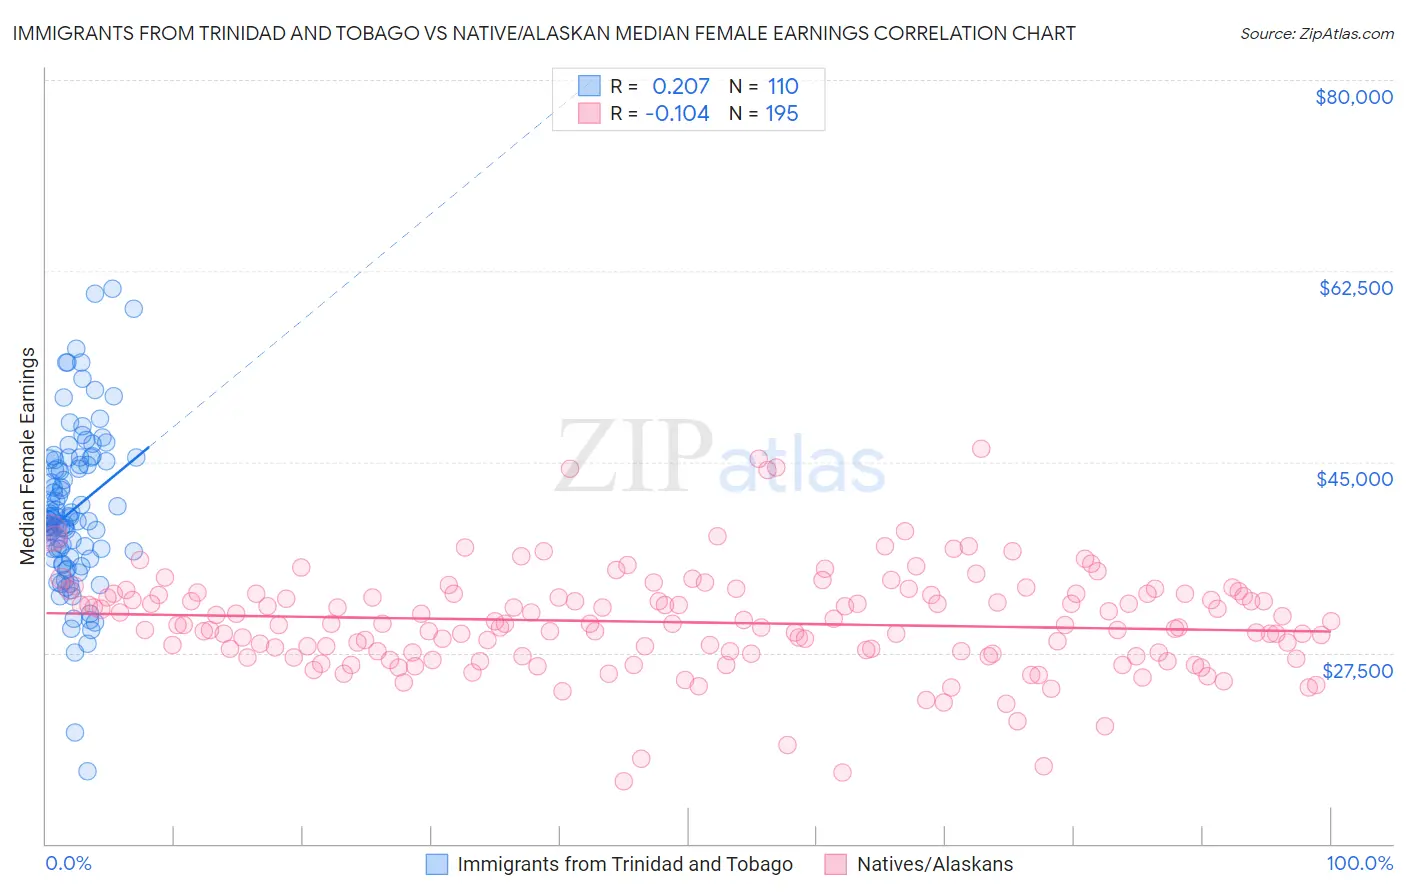
Immigrants from Trinidad and Tobago vs Native/Alaskan Median Female Earnings Correlation Chart
The statistical analysis conducted on geographies consisting of 223,490,788 people shows a weak positive correlation between the proportion of Immigrants from Trinidad and Tobago and median female earnings in the United States with a correlation coefficient (R) of 0.207 and weighted average of $40,895. Similarly, the statistical analysis conducted on geographies consisting of 512,112,793 people shows a poor negative correlation between the proportion of Natives/Alaskans and median female earnings in the United States with a correlation coefficient (R) of -0.104 and weighted average of $33,806, a difference of 21.0%.
Median Female Earnings Correlation Summary
| Measurement | Immigrants from Trinidad and Tobago | Native/Alaskan |
| Minimum | $16,600 | $15,696 |
| Maximum | $60,818 | $46,195 |
| Range | $44,218 | $30,499 |
| Mean | $40,591 | $30,297 |
| Median | $39,706 | $30,121 |
| Interquartile 25% (IQ1) | $36,241 | $27,399 |
| Interquartile 75% (IQ3) | $45,207 | $32,868 |
| Interquartile Range (IQR) | $8,965 | $5,469 |
| Standard Deviation (Sample) | $7,375 | $4,739 |
| Standard Deviation (Population) | $7,342 | $4,727 |
Similar Demographics by Median Female Earnings
Demographics Similar to Immigrants from Trinidad and Tobago by Median Female Earnings
In terms of median female earnings, the demographic groups most similar to Immigrants from Trinidad and Tobago are Ugandan ($40,889, a difference of 0.020%), Austrian ($40,923, a difference of 0.070%), Trinidadian and Tobagonian ($40,958, a difference of 0.15%), Carpatho Rusyn ($40,825, a difference of 0.17%), and Guyanese ($40,973, a difference of 0.19%).
| Demographics | Rating | Rank | Median Female Earnings |
| Immigrants | Philippines | 95.0 /100 | #119 | Exceptional $41,114 |
| Immigrants | Kuwait | 94.4 /100 | #120 | Exceptional $41,055 |
| Croatians | 93.7 /100 | #121 | Exceptional $40,993 |
| Immigrants | Jordan | 93.5 /100 | #122 | Exceptional $40,977 |
| Guyanese | 93.4 /100 | #123 | Exceptional $40,973 |
| Trinidadians and Tobagonians | 93.2 /100 | #124 | Exceptional $40,958 |
| Austrians | 92.7 /100 | #125 | Exceptional $40,923 |
| Immigrants | Trinidad and Tobago | 92.3 /100 | #126 | Exceptional $40,895 |
| Ugandans | 92.2 /100 | #127 | Exceptional $40,889 |
| Carpatho Rusyns | 91.2 /100 | #128 | Exceptional $40,825 |
| Zimbabweans | 90.8 /100 | #129 | Exceptional $40,798 |
| Immigrants | Guyana | 90.3 /100 | #130 | Exceptional $40,773 |
| Chileans | 90.0 /100 | #131 | Exceptional $40,757 |
| Immigrants | Uganda | 89.7 /100 | #132 | Excellent $40,739 |
| Syrians | 89.5 /100 | #133 | Excellent $40,727 |
Demographics Similar to Natives/Alaskans by Median Female Earnings
In terms of median female earnings, the demographic groups most similar to Natives/Alaskans are Choctaw ($33,775, a difference of 0.090%), Menominee ($33,894, a difference of 0.26%), Hopi ($33,932, a difference of 0.37%), Mexican ($33,664, a difference of 0.42%), and Immigrants from Central America ($33,953, a difference of 0.43%).
| Demographics | Rating | Rank | Median Female Earnings |
| Immigrants | Congo | 0.0 /100 | #324 | Tragic $34,317 |
| Dutch West Indians | 0.0 /100 | #325 | Tragic $34,106 |
| Kiowa | 0.0 /100 | #326 | Tragic $34,074 |
| Cajuns | 0.0 /100 | #327 | Tragic $34,034 |
| Immigrants | Central America | 0.0 /100 | #328 | Tragic $33,953 |
| Hopi | 0.0 /100 | #329 | Tragic $33,932 |
| Menominee | 0.0 /100 | #330 | Tragic $33,894 |
| Natives/Alaskans | 0.0 /100 | #331 | Tragic $33,806 |
| Choctaw | 0.0 /100 | #332 | Tragic $33,775 |
| Mexicans | 0.0 /100 | #333 | Tragic $33,664 |
| Spanish American Indians | 0.0 /100 | #334 | Tragic $33,625 |
| Creek | 0.0 /100 | #335 | Tragic $33,437 |
| Ottawa | 0.0 /100 | #336 | Tragic $33,378 |
| Yakama | 0.0 /100 | #337 | Tragic $33,354 |
| Immigrants | Cuba | 0.0 /100 | #338 | Tragic $33,291 |