Immigrants from Sweden vs South American Indian Householder Income Under 25 years
COMPARE
Immigrants from Sweden
South American Indian
Householder Income Under 25 years
Householder Income Under 25 years Comparison
Immigrants from Sweden
South American Indians
$53,621
HOUSEHOLDER INCOME UNDER 25 YEARS
97.1/ 100
METRIC RATING
114th/ 347
METRIC RANK
$52,979
HOUSEHOLDER INCOME UNDER 25 YEARS
87.3/ 100
METRIC RATING
144th/ 347
METRIC RANK
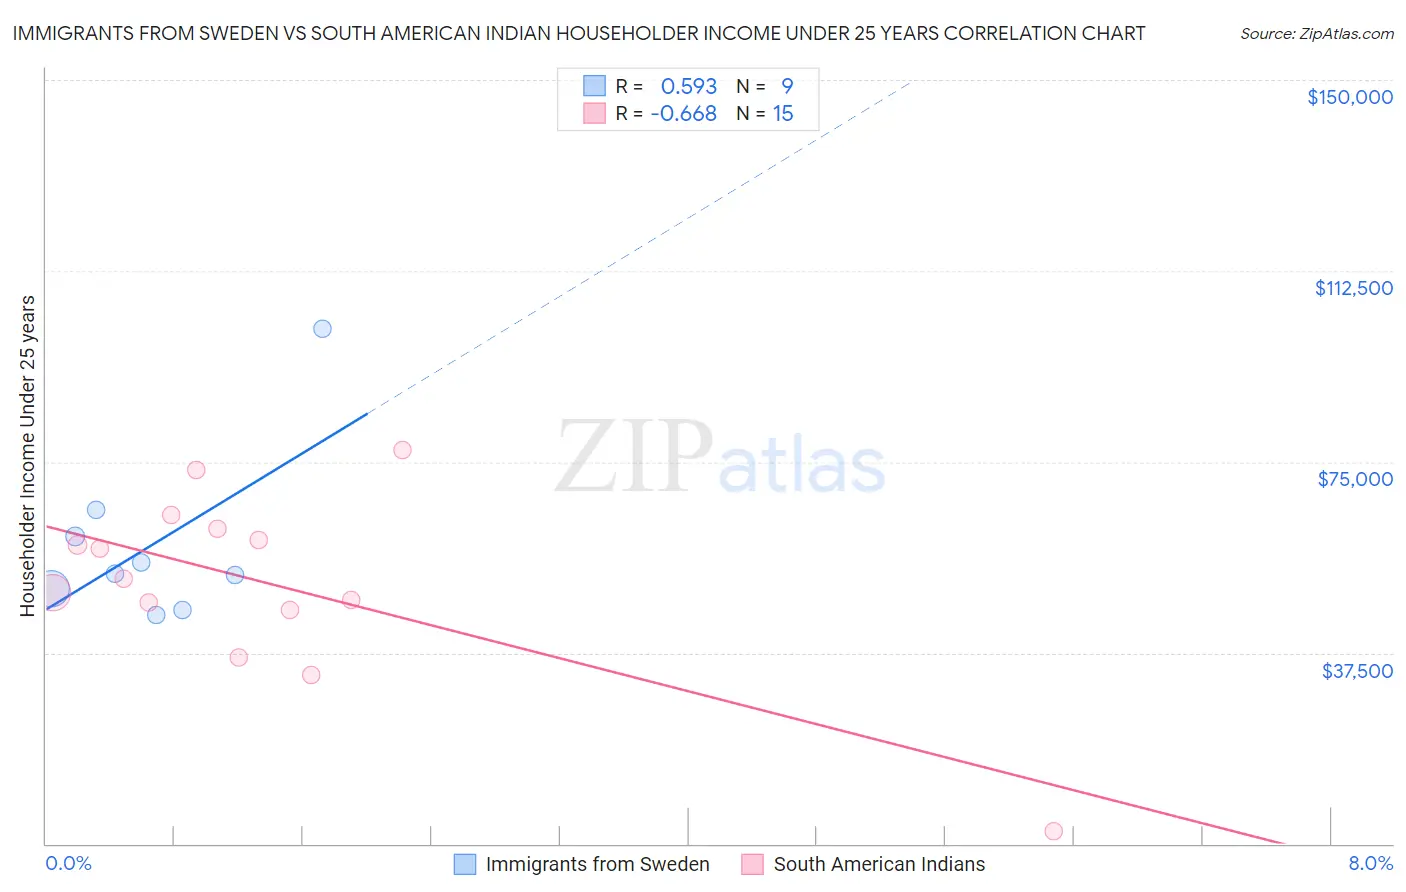
Immigrants from Sweden vs South American Indian Householder Income Under 25 years Correlation Chart
The statistical analysis conducted on geographies consisting of 146,742,584 people shows a substantial positive correlation between the proportion of Immigrants from Sweden and household income with householder under the age of 25 in the United States with a correlation coefficient (R) of 0.593 and weighted average of $53,621. Similarly, the statistical analysis conducted on geographies consisting of 149,724,736 people shows a significant negative correlation between the proportion of South American Indians and household income with householder under the age of 25 in the United States with a correlation coefficient (R) of -0.668 and weighted average of $52,979, a difference of 1.2%.
Householder Income Under 25 years Correlation Summary
| Measurement | Immigrants from Sweden | South American Indian |
| Minimum | $44,957 | $2,499 |
| Maximum | $101,141 | $77,389 |
| Range | $56,184 | $74,890 |
| Mean | $58,786 | $51,232 |
| Median | $52,949 | $52,040 |
| Interquartile 25% (IQ1) | $48,010 | $45,962 |
| Interquartile 75% (IQ3) | $62,961 | $61,870 |
| Interquartile Range (IQR) | $14,951 | $15,908 |
| Standard Deviation (Sample) | $17,165 | $18,152 |
| Standard Deviation (Population) | $16,183 | $17,536 |
Similar Demographics by Householder Income Under 25 years
Demographics Similar to Immigrants from Sweden by Householder Income Under 25 years
In terms of householder income under 25 years, the demographic groups most similar to Immigrants from Sweden are Romanian ($53,632, a difference of 0.020%), Immigrants from Albania ($53,597, a difference of 0.040%), Immigrants from Oceania ($53,680, a difference of 0.11%), Immigrants from Spain ($53,560, a difference of 0.11%), and Lithuanian ($53,552, a difference of 0.13%).
| Demographics | Rating | Rank | Householder Income Under 25 years |
| Australians | 97.8 /100 | #107 | Exceptional $53,739 |
| Maltese | 97.8 /100 | #108 | Exceptional $53,735 |
| Immigrants | Ecuador | 97.7 /100 | #109 | Exceptional $53,722 |
| Greeks | 97.7 /100 | #110 | Exceptional $53,715 |
| Immigrants | Colombia | 97.7 /100 | #111 | Exceptional $53,714 |
| Immigrants | Oceania | 97.5 /100 | #112 | Exceptional $53,680 |
| Romanians | 97.2 /100 | #113 | Exceptional $53,632 |
| Immigrants | Sweden | 97.1 /100 | #114 | Exceptional $53,621 |
| Immigrants | Albania | 96.9 /100 | #115 | Exceptional $53,597 |
| Immigrants | Spain | 96.6 /100 | #116 | Exceptional $53,560 |
| Lithuanians | 96.6 /100 | #117 | Exceptional $53,552 |
| Immigrants | Switzerland | 96.3 /100 | #118 | Exceptional $53,528 |
| Italians | 95.4 /100 | #119 | Exceptional $53,426 |
| Guamanians/Chamorros | 95.3 /100 | #120 | Exceptional $53,423 |
| Immigrants | Canada | 95.2 /100 | #121 | Exceptional $53,411 |
Demographics Similar to South American Indians by Householder Income Under 25 years
In terms of householder income under 25 years, the demographic groups most similar to South American Indians are Immigrants from Armenia ($52,986, a difference of 0.010%), Swedish ($52,986, a difference of 0.010%), Immigrants from Western Europe ($52,957, a difference of 0.040%), Danish ($53,041, a difference of 0.12%), and Hawaiian ($53,078, a difference of 0.19%).
| Demographics | Rating | Rank | Householder Income Under 25 years |
| Immigrants | Barbados | 91.5 /100 | #137 | Exceptional $53,163 |
| Norwegians | 90.8 /100 | #138 | Exceptional $53,127 |
| Costa Ricans | 90.4 /100 | #139 | Exceptional $53,106 |
| Hawaiians | 89.8 /100 | #140 | Excellent $53,078 |
| Danes | 88.9 /100 | #141 | Excellent $53,041 |
| Immigrants | Armenia | 87.5 /100 | #142 | Excellent $52,986 |
| Swedes | 87.5 /100 | #143 | Excellent $52,986 |
| South American Indians | 87.3 /100 | #144 | Excellent $52,979 |
| Immigrants | Western Europe | 86.7 /100 | #145 | Excellent $52,957 |
| Immigrants | Hungary | 81.6 /100 | #146 | Excellent $52,798 |
| Latvians | 81.0 /100 | #147 | Excellent $52,783 |
| French Canadians | 76.5 /100 | #148 | Good $52,672 |
| Scandinavians | 75.7 /100 | #149 | Good $52,654 |
| Immigrants | Costa Rica | 75.2 /100 | #150 | Good $52,643 |
| Immigrants | Scotland | 75.0 /100 | #151 | Good $52,638 |