Immigrants from Sweden vs Immigrants from Singapore Median Female Earnings
COMPARE
Immigrants from Sweden
Immigrants from Singapore
Median Female Earnings
Median Female Earnings Comparison
Immigrants from Sweden
Immigrants from Singapore
$44,774
MEDIAN FEMALE EARNINGS
100.0/ 100
METRIC RATING
25th/ 347
METRIC RANK
$47,986
MEDIAN FEMALE EARNINGS
100.0/ 100
METRIC RATING
5th/ 347
METRIC RANK
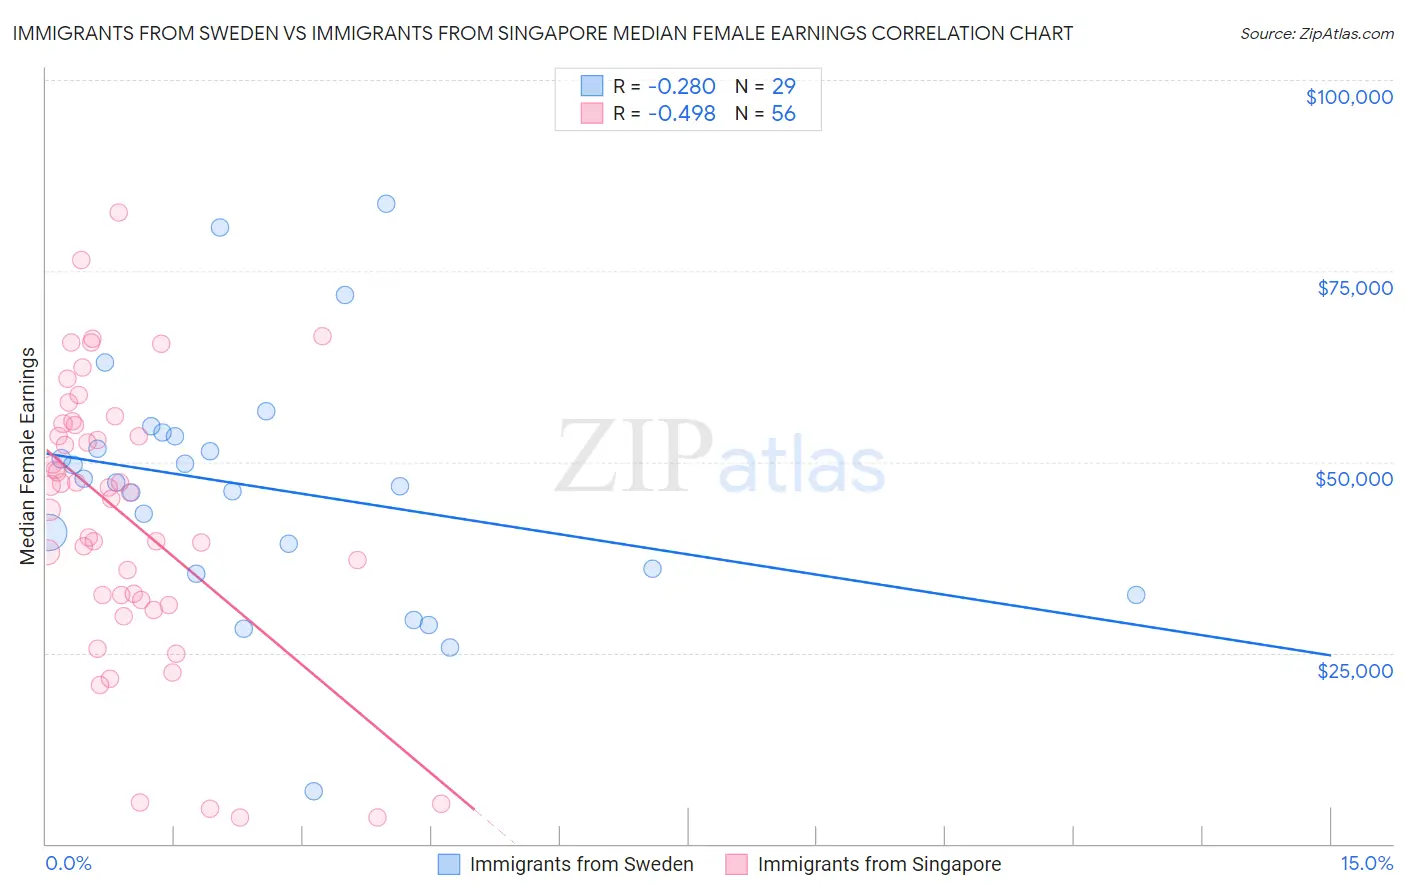
Immigrants from Sweden vs Immigrants from Singapore Median Female Earnings Correlation Chart
The statistical analysis conducted on geographies consisting of 164,714,291 people shows a weak negative correlation between the proportion of Immigrants from Sweden and median female earnings in the United States with a correlation coefficient (R) of -0.280 and weighted average of $44,774. Similarly, the statistical analysis conducted on geographies consisting of 137,511,050 people shows a moderate negative correlation between the proportion of Immigrants from Singapore and median female earnings in the United States with a correlation coefficient (R) of -0.498 and weighted average of $47,986, a difference of 7.2%.
Median Female Earnings Correlation Summary
| Measurement | Immigrants from Sweden | Immigrants from Singapore |
| Minimum | $6,800 | $3,385 |
| Maximum | $83,727 | $82,574 |
| Range | $76,927 | $79,189 |
| Mean | $46,568 | $42,827 |
| Median | $47,333 | $46,291 |
| Interquartile 25% (IQ1) | $35,642 | $32,188 |
| Interquartile 75% (IQ3) | $53,626 | $54,889 |
| Interquartile Range (IQR) | $17,985 | $22,702 |
| Standard Deviation (Sample) | $16,157 | $18,237 |
| Standard Deviation (Population) | $15,876 | $18,074 |
Demographics Similar to Immigrants from Sweden and Immigrants from Singapore by Median Female Earnings
In terms of median female earnings, the demographic groups most similar to Immigrants from Sweden are Immigrants from Korea ($44,847, a difference of 0.16%), Burmese ($44,911, a difference of 0.31%), Immigrants from Greece ($44,976, a difference of 0.45%), Cambodian ($45,014, a difference of 0.54%), and Immigrants from Japan ($45,323, a difference of 1.2%). Similarly, the demographic groups most similar to Immigrants from Singapore are Immigrants from Ireland ($47,598, a difference of 0.82%), Thai ($47,577, a difference of 0.86%), Iranian ($47,421, a difference of 1.2%), Immigrants from Iran ($47,154, a difference of 1.8%), and Immigrants from China ($46,972, a difference of 2.2%).
| Demographics | Rating | Rank | Median Female Earnings |
| Immigrants | Singapore | 100.0 /100 | #5 | Exceptional $47,986 |
| Immigrants | Ireland | 100.0 /100 | #6 | Exceptional $47,598 |
| Thais | 100.0 /100 | #7 | Exceptional $47,577 |
| Iranians | 100.0 /100 | #8 | Exceptional $47,421 |
| Immigrants | Iran | 100.0 /100 | #9 | Exceptional $47,154 |
| Immigrants | China | 100.0 /100 | #10 | Exceptional $46,972 |
| Okinawans | 100.0 /100 | #11 | Exceptional $46,905 |
| Immigrants | Israel | 100.0 /100 | #12 | Exceptional $46,902 |
| Immigrants | Australia | 100.0 /100 | #13 | Exceptional $46,573 |
| Soviet Union | 100.0 /100 | #14 | Exceptional $46,556 |
| Immigrants | Eastern Asia | 100.0 /100 | #15 | Exceptional $46,502 |
| Indians (Asian) | 100.0 /100 | #16 | Exceptional $46,481 |
| Immigrants | South Central Asia | 100.0 /100 | #17 | Exceptional $46,324 |
| Cypriots | 100.0 /100 | #18 | Exceptional $45,570 |
| Eastern Europeans | 100.0 /100 | #19 | Exceptional $45,385 |
| Immigrants | Japan | 100.0 /100 | #20 | Exceptional $45,323 |
| Cambodians | 100.0 /100 | #21 | Exceptional $45,014 |
| Immigrants | Greece | 100.0 /100 | #22 | Exceptional $44,976 |
| Burmese | 100.0 /100 | #23 | Exceptional $44,911 |
| Immigrants | Korea | 100.0 /100 | #24 | Exceptional $44,847 |
| Immigrants | Sweden | 100.0 /100 | #25 | Exceptional $44,774 |