Immigrants from Sweden vs Immigrants from Armenia Disability Age 35 to 64
COMPARE
Immigrants from Sweden
Immigrants from Armenia
Disability Age 35 to 64
Disability Age 35 to 64 Comparison
Immigrants from Sweden
Immigrants from Armenia
9.9%
DISABILITY AGE 35 TO 64
99.7/ 100
METRIC RATING
59th/ 347
METRIC RANK
9.7%
DISABILITY AGE 35 TO 64
99.9/ 100
METRIC RATING
40th/ 347
METRIC RANK
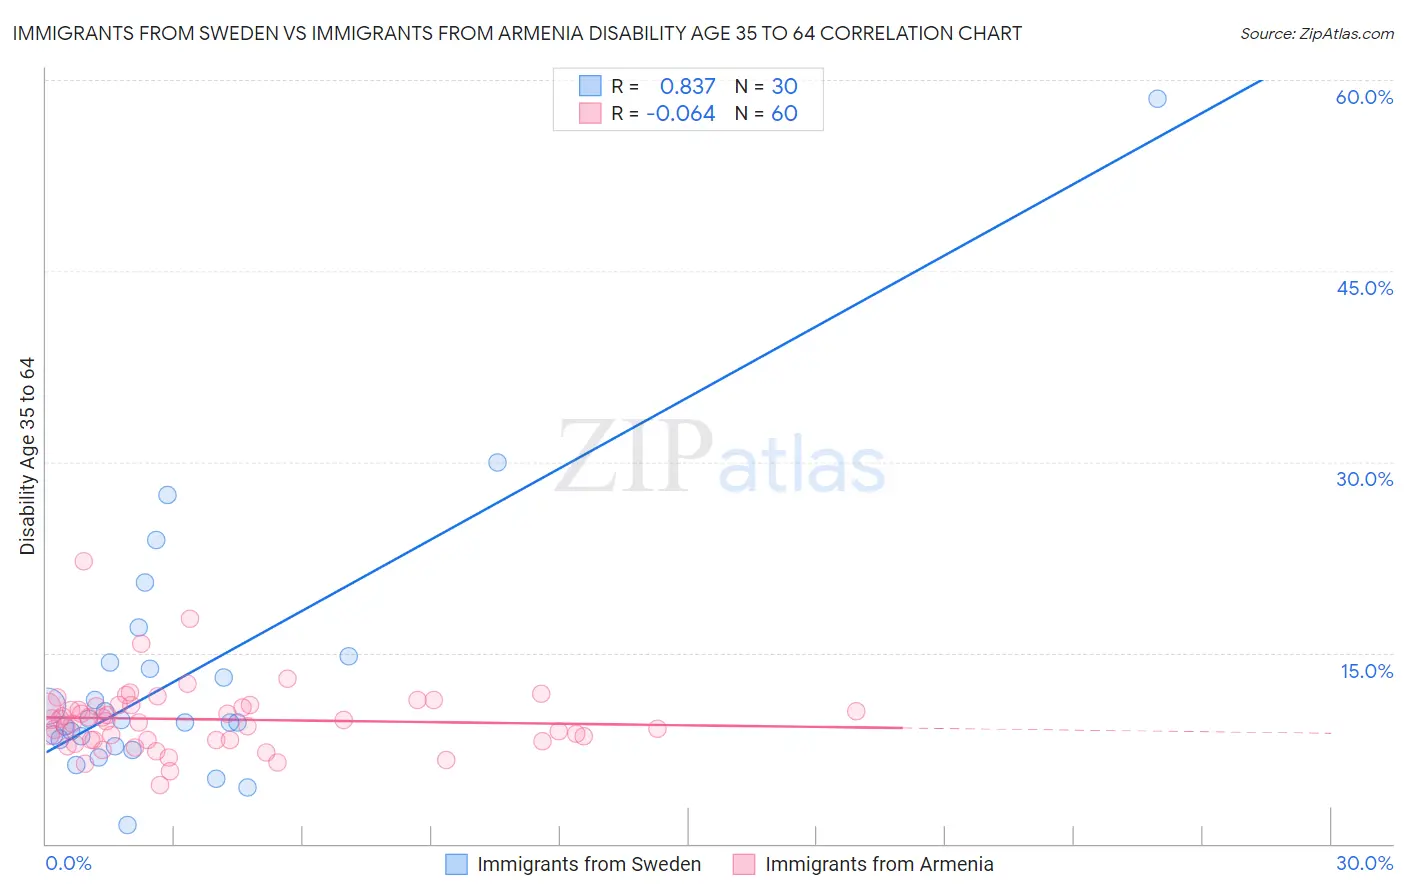
Immigrants from Sweden vs Immigrants from Armenia Disability Age 35 to 64 Correlation Chart
The statistical analysis conducted on geographies consisting of 164,695,763 people shows a very strong positive correlation between the proportion of Immigrants from Sweden and percentage of population with a disability between the ages 34 and 64 in the United States with a correlation coefficient (R) of 0.837 and weighted average of 9.9%. Similarly, the statistical analysis conducted on geographies consisting of 97,707,471 people shows a slight negative correlation between the proportion of Immigrants from Armenia and percentage of population with a disability between the ages 34 and 64 in the United States with a correlation coefficient (R) of -0.064 and weighted average of 9.7%, a difference of 2.1%.
Disability Age 35 to 64 Correlation Summary
| Measurement | Immigrants from Sweden | Immigrants from Armenia |
| Minimum | 1.4% | 4.6% |
| Maximum | 58.5% | 22.1% |
| Range | 57.1% | 17.5% |
| Mean | 13.2% | 9.8% |
| Median | 9.7% | 9.7% |
| Interquartile 25% (IQ1) | 8.2% | 8.2% |
| Interquartile 75% (IQ3) | 14.2% | 10.8% |
| Interquartile Range (IQR) | 6.0% | 2.7% |
| Standard Deviation (Sample) | 10.7% | 2.7% |
| Standard Deviation (Population) | 10.6% | 2.7% |
Demographics Similar to Immigrants from Sweden and Immigrants from Armenia by Disability Age 35 to 64
In terms of disability age 35 to 64, the demographic groups most similar to Immigrants from Sweden are Armenian (9.9%, a difference of 0.30%), Colombian (9.9%, a difference of 0.40%), South American (9.9%, a difference of 0.42%), Peruvian (9.9%, a difference of 0.64%), and Immigrants from Russia (9.8%, a difference of 0.70%). Similarly, the demographic groups most similar to Immigrants from Armenia are Immigrants from Belarus (9.7%, a difference of 0.070%), Israeli (9.7%, a difference of 0.12%), Immigrants from Malaysia (9.7%, a difference of 0.35%), Immigrants from Colombia (9.8%, a difference of 0.47%), and Immigrants from Egypt (9.8%, a difference of 0.76%).
| Demographics | Rating | Rank | Disability Age 35 to 64 |
| Immigrants | Belarus | 99.9 /100 | #39 | Exceptional 9.7% |
| Immigrants | Armenia | 99.9 /100 | #40 | Exceptional 9.7% |
| Israelis | 99.9 /100 | #41 | Exceptional 9.7% |
| Immigrants | Malaysia | 99.9 /100 | #42 | Exceptional 9.7% |
| Immigrants | Colombia | 99.9 /100 | #43 | Exceptional 9.8% |
| Immigrants | Egypt | 99.9 /100 | #44 | Exceptional 9.8% |
| Immigrants | Peru | 99.9 /100 | #45 | Exceptional 9.8% |
| Cambodians | 99.8 /100 | #46 | Exceptional 9.8% |
| Immigrants | Belgium | 99.8 /100 | #47 | Exceptional 9.8% |
| Immigrants | Serbia | 99.8 /100 | #48 | Exceptional 9.8% |
| Immigrants | Greece | 99.8 /100 | #49 | Exceptional 9.8% |
| Paraguayans | 99.8 /100 | #50 | Exceptional 9.8% |
| Bhutanese | 99.8 /100 | #51 | Exceptional 9.8% |
| Immigrants | Bulgaria | 99.8 /100 | #52 | Exceptional 9.8% |
| Taiwanese | 99.8 /100 | #53 | Exceptional 9.8% |
| Immigrants | Russia | 99.8 /100 | #54 | Exceptional 9.8% |
| Peruvians | 99.8 /100 | #55 | Exceptional 9.9% |
| South Americans | 99.8 /100 | #56 | Exceptional 9.9% |
| Colombians | 99.8 /100 | #57 | Exceptional 9.9% |
| Armenians | 99.8 /100 | #58 | Exceptional 9.9% |
| Immigrants | Sweden | 99.7 /100 | #59 | Exceptional 9.9% |