Immigrants from Sweden vs Haitian Female Unemployment
COMPARE
Immigrants from Sweden
Haitian
Female Unemployment
Female Unemployment Comparison
Immigrants from Sweden
Haitians
5.0%
FEMALE UNEMPLOYMENT
96.3/ 100
METRIC RATING
90th/ 347
METRIC RANK
6.1%
FEMALE UNEMPLOYMENT
0.0/ 100
METRIC RATING
288th/ 347
METRIC RANK
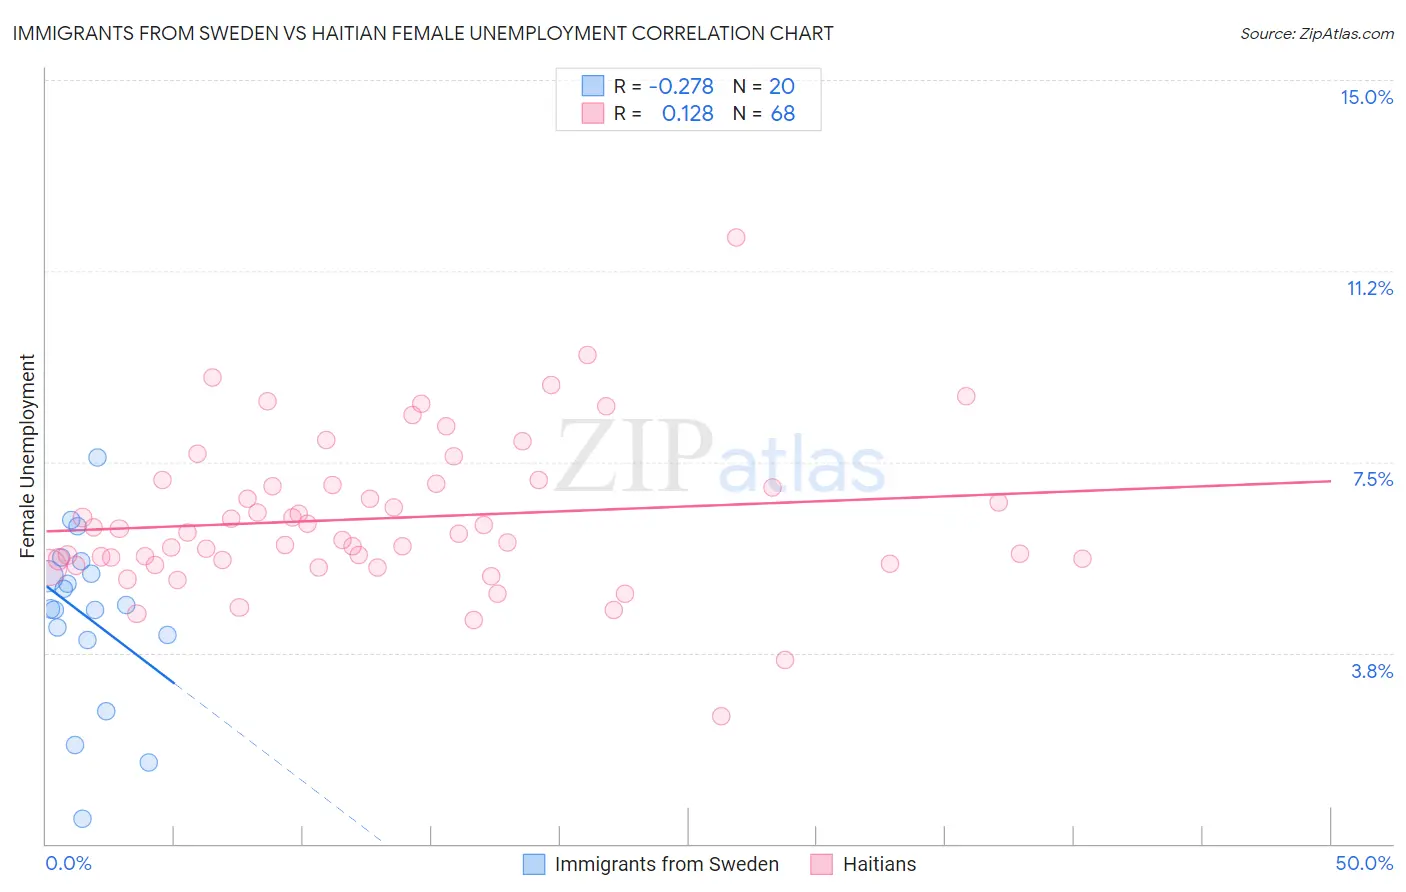
Immigrants from Sweden vs Haitian Female Unemployment Correlation Chart
The statistical analysis conducted on geographies consisting of 164,471,082 people shows a weak negative correlation between the proportion of Immigrants from Sweden and unemploymnet rate among females in the United States with a correlation coefficient (R) of -0.278 and weighted average of 5.0%. Similarly, the statistical analysis conducted on geographies consisting of 287,205,640 people shows a poor positive correlation between the proportion of Haitians and unemploymnet rate among females in the United States with a correlation coefficient (R) of 0.128 and weighted average of 6.1%, a difference of 21.7%.
Female Unemployment Correlation Summary
| Measurement | Immigrants from Sweden | Haitian |
| Minimum | 0.50% | 2.5% |
| Maximum | 7.6% | 11.9% |
| Range | 7.1% | 9.4% |
| Mean | 4.5% | 6.4% |
| Median | 4.7% | 6.1% |
| Interquartile 25% (IQ1) | 4.1% | 5.5% |
| Interquartile 75% (IQ3) | 5.4% | 7.1% |
| Interquartile Range (IQR) | 1.4% | 1.5% |
| Standard Deviation (Sample) | 1.7% | 1.5% |
| Standard Deviation (Population) | 1.7% | 1.5% |
Similar Demographics by Female Unemployment
Demographics Similar to Immigrants from Sweden by Female Unemployment
In terms of female unemployment, the demographic groups most similar to Immigrants from Sweden are Immigrants from Japan (5.0%, a difference of 0.12%), Romanian (5.0%, a difference of 0.14%), Immigrants from Taiwan (5.0%, a difference of 0.17%), Immigrants from Sudan (5.0%, a difference of 0.22%), and Immigrants from Austria (5.0%, a difference of 0.22%).
| Demographics | Rating | Rank | Female Unemployment |
| Immigrants | Serbia | 97.2 /100 | #83 | Exceptional 5.0% |
| Canadians | 97.2 /100 | #84 | Exceptional 5.0% |
| Ukrainians | 97.1 /100 | #85 | Exceptional 5.0% |
| Bolivians | 97.1 /100 | #86 | Exceptional 5.0% |
| Venezuelans | 96.9 /100 | #87 | Exceptional 5.0% |
| Immigrants | Sudan | 96.7 /100 | #88 | Exceptional 5.0% |
| Immigrants | Taiwan | 96.6 /100 | #89 | Exceptional 5.0% |
| Immigrants | Sweden | 96.3 /100 | #90 | Exceptional 5.0% |
| Immigrants | Japan | 96.0 /100 | #91 | Exceptional 5.0% |
| Romanians | 95.9 /100 | #92 | Exceptional 5.0% |
| Immigrants | Austria | 95.7 /100 | #93 | Exceptional 5.0% |
| Immigrants | Malaysia | 95.7 /100 | #94 | Exceptional 5.0% |
| Burmese | 95.6 /100 | #95 | Exceptional 5.0% |
| Immigrants | South Central Asia | 95.5 /100 | #96 | Exceptional 5.0% |
| Immigrants | Somalia | 95.2 /100 | #97 | Exceptional 5.0% |
Demographics Similar to Haitians by Female Unemployment
In terms of female unemployment, the demographic groups most similar to Haitians are Trinidadian and Tobagonian (6.1%, a difference of 0.010%), Immigrants from Guatemala (6.1%, a difference of 0.040%), Chippewa (6.1%, a difference of 0.070%), Immigrants from Caribbean (6.1%, a difference of 0.070%), and Immigrants from Cabo Verde (6.1%, a difference of 0.10%).
| Demographics | Rating | Rank | Female Unemployment |
| Guatemalans | 0.0 /100 | #281 | Tragic 6.0% |
| Colville | 0.0 /100 | #282 | Tragic 6.0% |
| Salvadorans | 0.0 /100 | #283 | Tragic 6.0% |
| Immigrants | Senegal | 0.0 /100 | #284 | Tragic 6.1% |
| Immigrants | Cabo Verde | 0.0 /100 | #285 | Tragic 6.1% |
| Chippewa | 0.0 /100 | #286 | Tragic 6.1% |
| Immigrants | Guatemala | 0.0 /100 | #287 | Tragic 6.1% |
| Haitians | 0.0 /100 | #288 | Tragic 6.1% |
| Trinidadians and Tobagonians | 0.0 /100 | #289 | Tragic 6.1% |
| Immigrants | Caribbean | 0.0 /100 | #290 | Tragic 6.1% |
| Immigrants | West Indies | 0.0 /100 | #291 | Tragic 6.1% |
| Immigrants | Trinidad and Tobago | 0.0 /100 | #292 | Tragic 6.1% |
| Mexicans | 0.0 /100 | #293 | Tragic 6.1% |
| Immigrants | El Salvador | 0.0 /100 | #294 | Tragic 6.1% |
| Immigrants | Latin America | 0.0 /100 | #295 | Tragic 6.1% |