Guyanese vs Malaysian Median Family Income
COMPARE
Guyanese
Malaysian
Median Family Income
Median Family Income Comparison
Guyanese
Malaysians
$93,373
MEDIAN FAMILY INCOME
0.9/ 100
METRIC RATING
246th/ 347
METRIC RANK
$95,230
MEDIAN FAMILY INCOME
2.2/ 100
METRIC RATING
230th/ 347
METRIC RANK
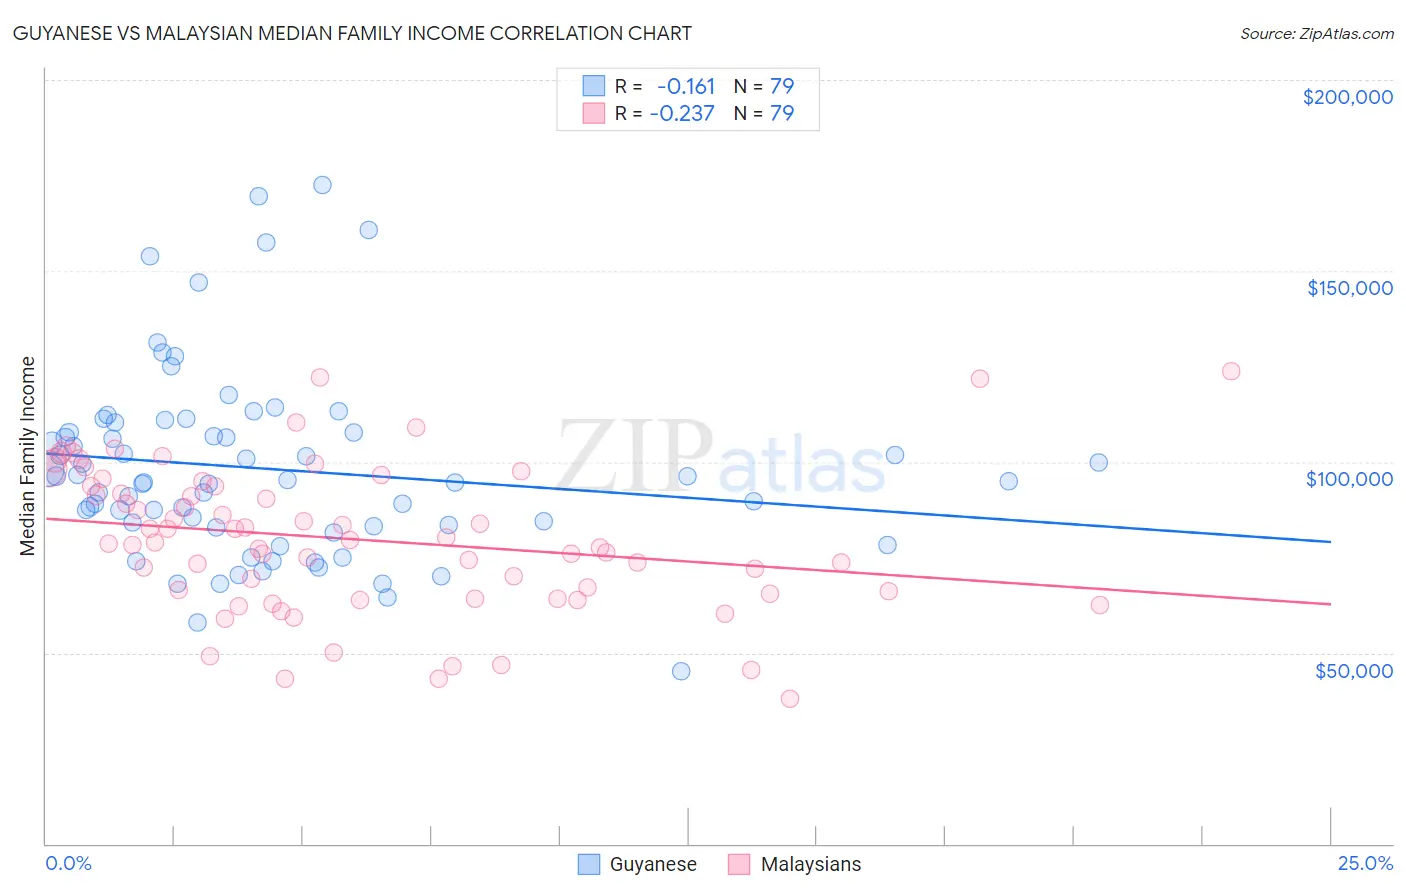
Guyanese vs Malaysian Median Family Income Correlation Chart
The statistical analysis conducted on geographies consisting of 176,743,960 people shows a poor negative correlation between the proportion of Guyanese and median family income in the United States with a correlation coefficient (R) of -0.161 and weighted average of $93,373. Similarly, the statistical analysis conducted on geographies consisting of 225,953,352 people shows a weak negative correlation between the proportion of Malaysians and median family income in the United States with a correlation coefficient (R) of -0.237 and weighted average of $95,230, a difference of 2.0%.
Median Family Income Correlation Summary
| Measurement | Guyanese | Malaysian |
| Minimum | $45,100 | $38,021 |
| Maximum | $172,597 | $123,750 |
| Range | $127,497 | $85,729 |
| Mean | $98,114 | $79,701 |
| Median | $94,843 | $78,842 |
| Interquartile 25% (IQ1) | $83,119 | $65,625 |
| Interquartile 75% (IQ3) | $107,693 | $93,739 |
| Interquartile Range (IQR) | $24,574 | $28,114 |
| Standard Deviation (Sample) | $24,573 | $19,147 |
| Standard Deviation (Population) | $24,417 | $19,025 |
Demographics Similar to Guyanese and Malaysians by Median Family Income
In terms of median family income, the demographic groups most similar to Guyanese are Immigrants from Middle Africa ($93,593, a difference of 0.23%), Subsaharan African ($93,748, a difference of 0.40%), Immigrants from Senegal ($92,912, a difference of 0.50%), German Russian ($93,858, a difference of 0.52%), and French American Indian ($92,872, a difference of 0.54%). Similarly, the demographic groups most similar to Malaysians are Marshallese ($95,293, a difference of 0.070%), Ecuadorian ($95,114, a difference of 0.12%), Immigrants from the Azores ($95,402, a difference of 0.18%), Immigrants from Venezuela ($94,904, a difference of 0.34%), and Immigrants from Bangladesh ($94,665, a difference of 0.60%).
| Demographics | Rating | Rank | Median Family Income |
| Immigrants | Azores | 2.4 /100 | #228 | Tragic $95,402 |
| Marshallese | 2.2 /100 | #229 | Tragic $95,293 |
| Malaysians | 2.2 /100 | #230 | Tragic $95,230 |
| Ecuadorians | 2.1 /100 | #231 | Tragic $95,114 |
| Immigrants | Venezuela | 1.9 /100 | #232 | Tragic $94,904 |
| Immigrants | Bangladesh | 1.6 /100 | #233 | Tragic $94,665 |
| Immigrants | Western Africa | 1.6 /100 | #234 | Tragic $94,638 |
| Immigrants | Burma/Myanmar | 1.5 /100 | #235 | Tragic $94,472 |
| Trinidadians and Tobagonians | 1.5 /100 | #236 | Tragic $94,466 |
| Alaskan Athabascans | 1.5 /100 | #237 | Tragic $94,429 |
| Nepalese | 1.3 /100 | #238 | Tragic $94,153 |
| Salvadorans | 1.2 /100 | #239 | Tragic $94,109 |
| Somalis | 1.2 /100 | #240 | Tragic $94,085 |
| Immigrants | Trinidad and Tobago | 1.2 /100 | #241 | Tragic $93,988 |
| Barbadians | 1.1 /100 | #242 | Tragic $93,919 |
| German Russians | 1.1 /100 | #243 | Tragic $93,858 |
| Sub-Saharan Africans | 1.0 /100 | #244 | Tragic $93,748 |
| Immigrants | Middle Africa | 1.0 /100 | #245 | Tragic $93,593 |
| Guyanese | 0.9 /100 | #246 | Tragic $93,373 |
| Immigrants | Senegal | 0.7 /100 | #247 | Tragic $92,912 |
| French American Indians | 0.7 /100 | #248 | Tragic $92,872 |