Fijian vs Cree Householder Income Ages 45 - 64 years
COMPARE
Fijian
Cree
Householder Income Ages 45 - 64 years
Householder Income Ages 45 - 64 years Comparison
Fijians
Cree
$85,187
HOUSEHOLDER INCOME AGES 45 - 64 YEARS
0.1/ 100
METRIC RATING
297th/ 347
METRIC RANK
$87,185
HOUSEHOLDER INCOME AGES 45 - 64 YEARS
0.1/ 100
METRIC RATING
277th/ 347
METRIC RANK
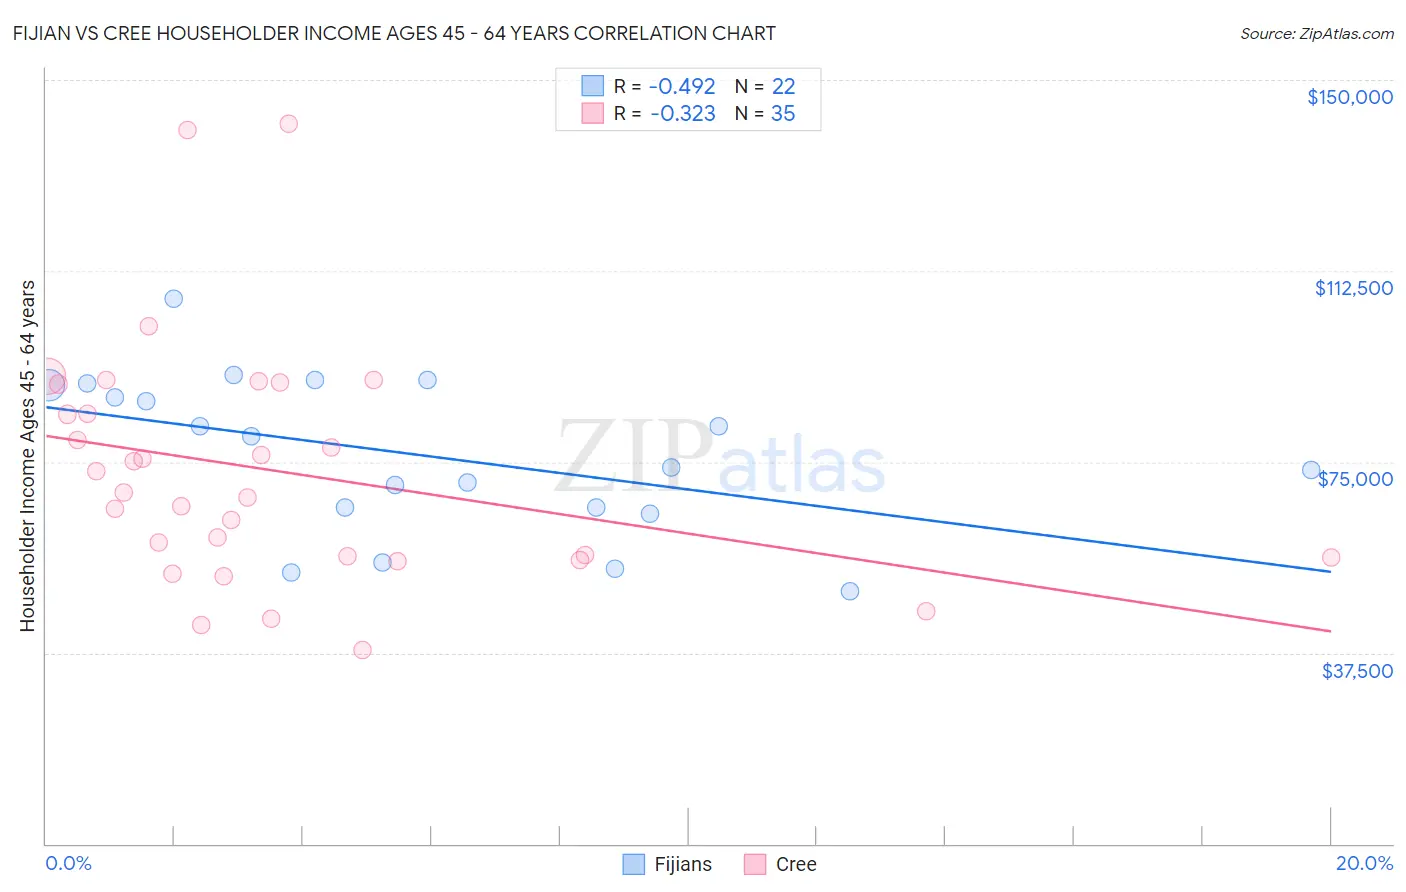
Fijian vs Cree Householder Income Ages 45 - 64 years Correlation Chart
The statistical analysis conducted on geographies consisting of 55,936,100 people shows a moderate negative correlation between the proportion of Fijians and household income with householder between the ages 45 and 64 in the United States with a correlation coefficient (R) of -0.492 and weighted average of $85,187. Similarly, the statistical analysis conducted on geographies consisting of 76,173,826 people shows a mild negative correlation between the proportion of Cree and household income with householder between the ages 45 and 64 in the United States with a correlation coefficient (R) of -0.323 and weighted average of $87,185, a difference of 2.4%.
Householder Income Ages 45 - 64 years Correlation Summary
| Measurement | Fijian | Cree |
| Minimum | $49,688 | $38,125 |
| Maximum | $107,109 | $141,447 |
| Range | $57,421 | $103,322 |
| Mean | $76,278 | $73,266 |
| Median | $76,951 | $69,060 |
| Interquartile 25% (IQ1) | $65,957 | $56,250 |
| Interquartile 75% (IQ3) | $90,029 | $90,223 |
| Interquartile Range (IQR) | $24,072 | $33,973 |
| Standard Deviation (Sample) | $15,327 | $23,520 |
| Standard Deviation (Population) | $14,974 | $23,182 |
Demographics Similar to Fijians and Cree by Householder Income Ages 45 - 64 years
In terms of householder income ages 45 - 64 years, the demographic groups most similar to Fijians are Immigrants from Zaire ($85,207, a difference of 0.020%), Immigrants from Grenada ($85,552, a difference of 0.43%), British West Indian ($85,571, a difference of 0.45%), Comanche ($85,787, a difference of 0.70%), and Immigrants from Central America ($85,965, a difference of 0.91%). Similarly, the demographic groups most similar to Cree are Immigrants from Jamaica ($87,035, a difference of 0.17%), Yakama ($86,992, a difference of 0.22%), Immigrants from Somalia ($86,987, a difference of 0.23%), Yaqui ($86,914, a difference of 0.31%), and Senegalese ($86,897, a difference of 0.33%).
| Demographics | Rating | Rank | Householder Income Ages 45 - 64 years |
| Cree | 0.1 /100 | #277 | Tragic $87,185 |
| Immigrants | Jamaica | 0.1 /100 | #278 | Tragic $87,035 |
| Yakama | 0.1 /100 | #279 | Tragic $86,992 |
| Immigrants | Somalia | 0.1 /100 | #280 | Tragic $86,987 |
| Yaqui | 0.1 /100 | #281 | Tragic $86,914 |
| Senegalese | 0.1 /100 | #282 | Tragic $86,897 |
| Mexicans | 0.1 /100 | #283 | Tragic $86,816 |
| Central American Indians | 0.1 /100 | #284 | Tragic $86,764 |
| Blackfeet | 0.1 /100 | #285 | Tragic $86,595 |
| Immigrants | Guatemala | 0.1 /100 | #286 | Tragic $86,573 |
| Bangladeshis | 0.1 /100 | #287 | Tragic $86,402 |
| Immigrants | St. Vincent and the Grenadines | 0.1 /100 | #288 | Tragic $86,394 |
| Cubans | 0.1 /100 | #289 | Tragic $86,301 |
| Cherokee | 0.1 /100 | #290 | Tragic $86,125 |
| Hispanics or Latinos | 0.1 /100 | #291 | Tragic $86,006 |
| Immigrants | Central America | 0.1 /100 | #292 | Tragic $85,965 |
| Comanche | 0.1 /100 | #293 | Tragic $85,787 |
| British West Indians | 0.1 /100 | #294 | Tragic $85,571 |
| Immigrants | Grenada | 0.1 /100 | #295 | Tragic $85,552 |
| Immigrants | Zaire | 0.1 /100 | #296 | Tragic $85,207 |
| Fijians | 0.1 /100 | #297 | Tragic $85,187 |