Immigrants from Spain vs Polish Median Male Earnings
COMPARE
Immigrants from Spain
Polish
Median Male Earnings
Median Male Earnings Comparison
Immigrants from Spain
Poles
$60,750
MEDIAN MALE EARNINGS
99.8/ 100
METRIC RATING
67th/ 347
METRIC RANK
$58,139
MEDIAN MALE EARNINGS
97.3/ 100
METRIC RATING
103rd/ 347
METRIC RANK
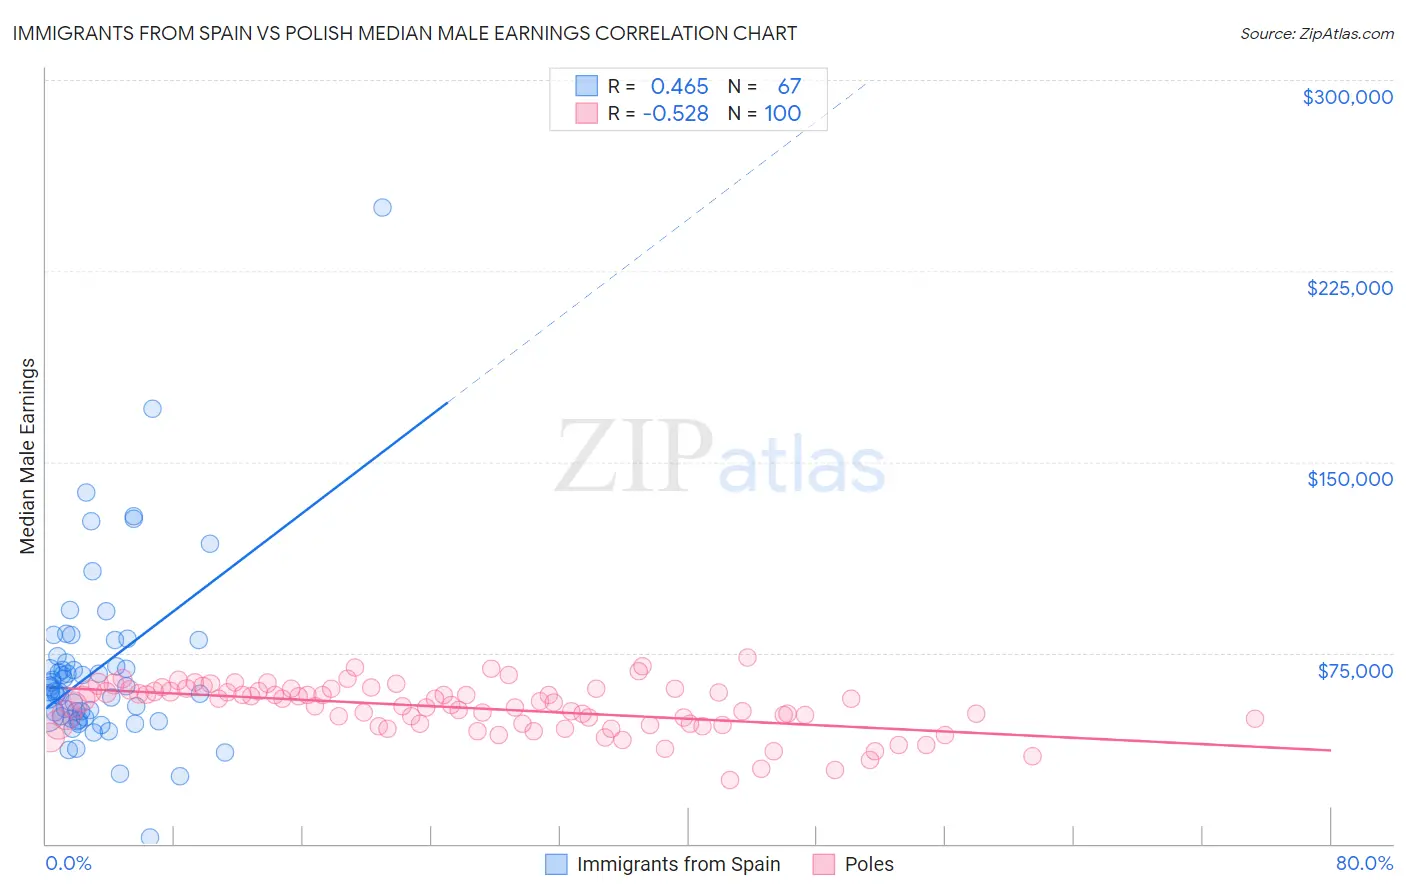
Immigrants from Spain vs Polish Median Male Earnings Correlation Chart
The statistical analysis conducted on geographies consisting of 239,649,237 people shows a moderate positive correlation between the proportion of Immigrants from Spain and median male earnings in the United States with a correlation coefficient (R) of 0.465 and weighted average of $60,750. Similarly, the statistical analysis conducted on geographies consisting of 559,585,611 people shows a substantial negative correlation between the proportion of Poles and median male earnings in the United States with a correlation coefficient (R) of -0.528 and weighted average of $58,139, a difference of 4.5%.
Median Male Earnings Correlation Summary
| Measurement | Immigrants from Spain | Polish |
| Minimum | $2,499 | $25,204 |
| Maximum | $250,001 | $72,933 |
| Range | $247,502 | $47,729 |
| Mean | $68,720 | $53,382 |
| Median | $60,260 | $54,879 |
| Interquartile 25% (IQ1) | $49,576 | $46,953 |
| Interquartile 75% (IQ3) | $73,651 | $60,187 |
| Interquartile Range (IQR) | $24,075 | $13,234 |
| Standard Deviation (Sample) | $35,640 | $9,652 |
| Standard Deviation (Population) | $35,373 | $9,604 |
Similar Demographics by Median Male Earnings
Demographics Similar to Immigrants from Spain by Median Male Earnings
In terms of median male earnings, the demographic groups most similar to Immigrants from Spain are Immigrants from Serbia ($60,600, a difference of 0.25%), Immigrants from Croatia ($60,914, a difference of 0.27%), Immigrants from Indonesia ($60,935, a difference of 0.30%), Immigrants from Eastern Europe ($60,958, a difference of 0.34%), and Immigrants from Pakistan ($60,987, a difference of 0.39%).
| Demographics | Rating | Rank | Median Male Earnings |
| Egyptians | 99.8 /100 | #60 | Exceptional $61,095 |
| Bolivians | 99.8 /100 | #61 | Exceptional $61,066 |
| Immigrants | Romania | 99.8 /100 | #62 | Exceptional $61,040 |
| Immigrants | Pakistan | 99.8 /100 | #63 | Exceptional $60,987 |
| Immigrants | Eastern Europe | 99.8 /100 | #64 | Exceptional $60,958 |
| Immigrants | Indonesia | 99.8 /100 | #65 | Exceptional $60,935 |
| Immigrants | Croatia | 99.8 /100 | #66 | Exceptional $60,914 |
| Immigrants | Spain | 99.8 /100 | #67 | Exceptional $60,750 |
| Immigrants | Serbia | 99.7 /100 | #68 | Exceptional $60,600 |
| Immigrants | Canada | 99.7 /100 | #69 | Exceptional $60,388 |
| Immigrants | Bulgaria | 99.7 /100 | #70 | Exceptional $60,358 |
| Mongolians | 99.7 /100 | #71 | Exceptional $60,350 |
| Immigrants | Western Europe | 99.7 /100 | #72 | Exceptional $60,334 |
| Immigrants | North America | 99.7 /100 | #73 | Exceptional $60,265 |
| Argentineans | 99.6 /100 | #74 | Exceptional $60,117 |
Demographics Similar to Poles by Median Male Earnings
In terms of median male earnings, the demographic groups most similar to Poles are Armenian ($58,134, a difference of 0.010%), Immigrants from Western Asia ($58,131, a difference of 0.020%), Syrian ($58,187, a difference of 0.080%), Immigrants from Northern Africa ($58,008, a difference of 0.23%), and Serbian ($57,975, a difference of 0.28%).
| Demographics | Rating | Rank | Median Male Earnings |
| Albanians | 98.4 /100 | #96 | Exceptional $58,680 |
| Northern Europeans | 98.2 /100 | #97 | Exceptional $58,588 |
| Jordanians | 98.1 /100 | #98 | Exceptional $58,500 |
| Immigrants | Poland | 98.0 /100 | #99 | Exceptional $58,452 |
| Assyrians/Chaldeans/Syriacs | 97.9 /100 | #100 | Exceptional $58,437 |
| Immigrants | Brazil | 97.7 /100 | #101 | Exceptional $58,324 |
| Syrians | 97.4 /100 | #102 | Exceptional $58,187 |
| Poles | 97.3 /100 | #103 | Exceptional $58,139 |
| Armenians | 97.3 /100 | #104 | Exceptional $58,134 |
| Immigrants | Western Asia | 97.3 /100 | #105 | Exceptional $58,131 |
| Immigrants | Northern Africa | 96.9 /100 | #106 | Exceptional $58,008 |
| Serbians | 96.8 /100 | #107 | Exceptional $57,975 |
| Immigrants | Uzbekistan | 96.7 /100 | #108 | Exceptional $57,941 |
| British | 96.5 /100 | #109 | Exceptional $57,890 |
| Palestinians | 96.2 /100 | #110 | Exceptional $57,778 |