Immigrants from South Eastern Asia vs Pueblo 8th Grade
COMPARE
Immigrants from South Eastern Asia
Pueblo
8th Grade
8th Grade Comparison
Immigrants from South Eastern Asia
Pueblo
94.2%
8TH GRADE
0.0/ 100
METRIC RATING
297th/ 347
METRIC RANK
96.1%
8TH GRADE
92.3/ 100
METRIC RATING
131st/ 347
METRIC RANK
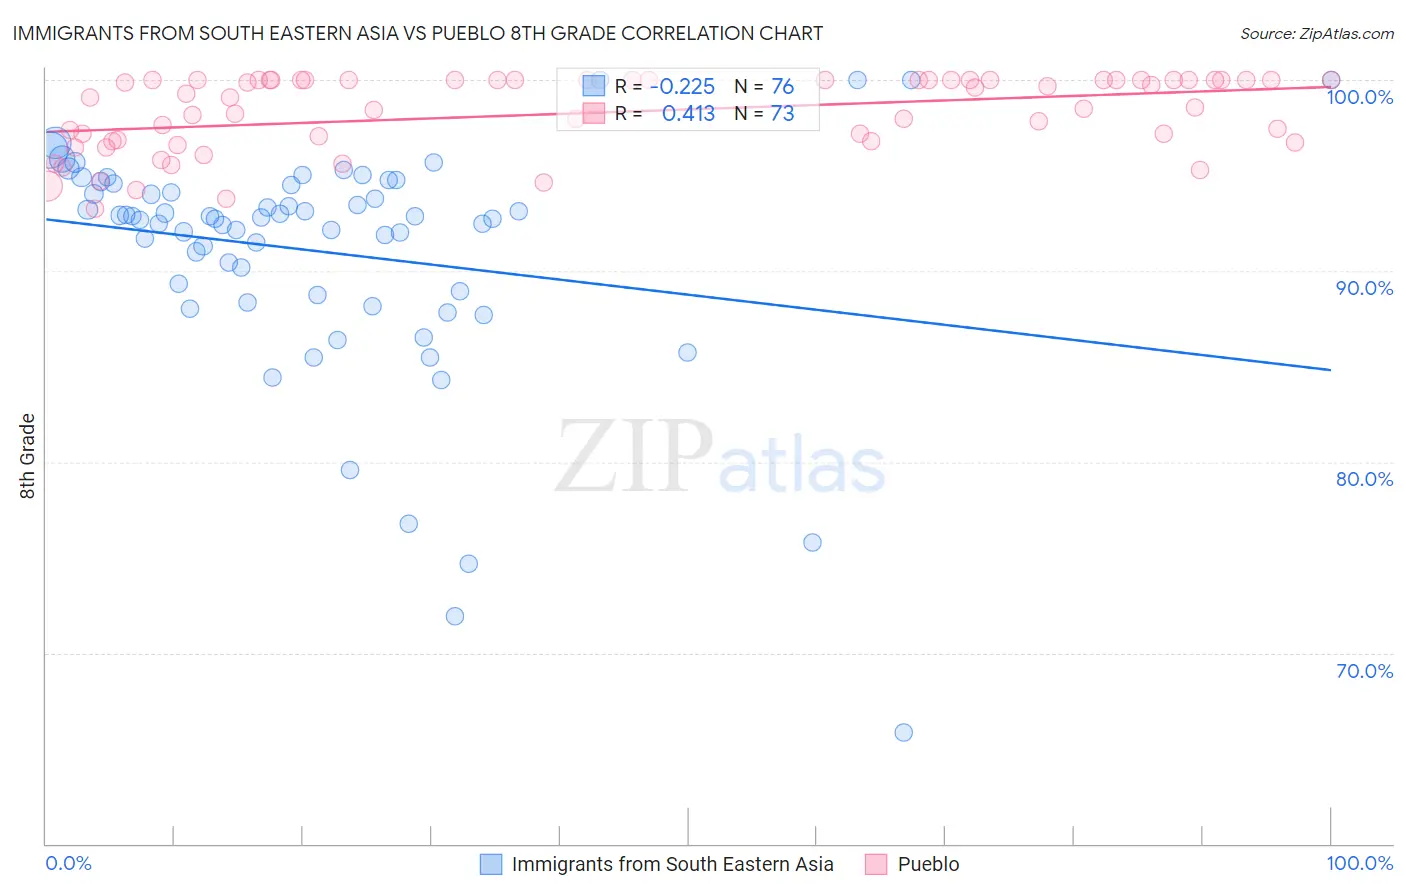
Immigrants from South Eastern Asia vs Pueblo 8th Grade Correlation Chart
The statistical analysis conducted on geographies consisting of 512,710,223 people shows a weak negative correlation between the proportion of Immigrants from South Eastern Asia and percentage of population with at least 8th grade education in the United States with a correlation coefficient (R) of -0.225 and weighted average of 94.2%. Similarly, the statistical analysis conducted on geographies consisting of 120,086,078 people shows a moderate positive correlation between the proportion of Pueblo and percentage of population with at least 8th grade education in the United States with a correlation coefficient (R) of 0.413 and weighted average of 96.1%, a difference of 2.1%.
8th Grade Correlation Summary
| Measurement | Immigrants from South Eastern Asia | Pueblo |
| Minimum | 65.9% | 93.2% |
| Maximum | 100.0% | 100.0% |
| Range | 34.1% | 6.8% |
| Mean | 91.0% | 98.3% |
| Median | 92.8% | 99.1% |
| Interquartile 25% (IQ1) | 88.8% | 96.8% |
| Interquartile 75% (IQ3) | 94.6% | 100.0% |
| Interquartile Range (IQR) | 5.7% | 3.2% |
| Standard Deviation (Sample) | 6.2% | 2.0% |
| Standard Deviation (Population) | 6.1% | 2.0% |
Similar Demographics by 8th Grade
Demographics Similar to Immigrants from South Eastern Asia by 8th Grade
In terms of 8th grade, the demographic groups most similar to Immigrants from South Eastern Asia are Haitian (94.2%, a difference of 0.010%), Fijian (94.2%, a difference of 0.030%), Yaqui (94.2%, a difference of 0.040%), Houma (94.2%, a difference of 0.040%), and Indonesian (94.1%, a difference of 0.040%).
| Demographics | Rating | Rank | 8th Grade |
| Immigrants | West Indies | 0.0 /100 | #290 | Tragic 94.3% |
| Immigrants | Grenada | 0.0 /100 | #291 | Tragic 94.3% |
| Bangladeshis | 0.0 /100 | #292 | Tragic 94.3% |
| Yaqui | 0.0 /100 | #293 | Tragic 94.2% |
| Houma | 0.0 /100 | #294 | Tragic 94.2% |
| Fijians | 0.0 /100 | #295 | Tragic 94.2% |
| Haitians | 0.0 /100 | #296 | Tragic 94.2% |
| Immigrants | South Eastern Asia | 0.0 /100 | #297 | Tragic 94.2% |
| Indonesians | 0.0 /100 | #298 | Tragic 94.1% |
| Cubans | 0.0 /100 | #299 | Tragic 94.1% |
| Immigrants | Burma/Myanmar | 0.0 /100 | #300 | Tragic 94.1% |
| Immigrants | Laos | 0.0 /100 | #301 | Tragic 94.1% |
| Sri Lankans | 0.0 /100 | #302 | Tragic 94.0% |
| Immigrants | Dominica | 0.0 /100 | #303 | Tragic 94.0% |
| Guyanese | 0.0 /100 | #304 | Tragic 93.9% |
Demographics Similar to Pueblo by 8th Grade
In terms of 8th grade, the demographic groups most similar to Pueblo are Immigrants from Kuwait (96.1%, a difference of 0.0%), Soviet Union (96.1%, a difference of 0.010%), Immigrants from Turkey (96.1%, a difference of 0.010%), Cheyenne (96.1%, a difference of 0.020%), and Immigrants from Hungary (96.1%, a difference of 0.020%).
| Demographics | Rating | Rank | 8th Grade |
| Palestinians | 94.6 /100 | #124 | Exceptional 96.2% |
| Immigrants | Romania | 94.1 /100 | #125 | Exceptional 96.2% |
| Choctaw | 94.0 /100 | #126 | Exceptional 96.2% |
| Immigrants | Serbia | 94.0 /100 | #127 | Exceptional 96.2% |
| Immigrants | Bosnia and Herzegovina | 93.9 /100 | #128 | Exceptional 96.2% |
| Cheyenne | 93.3 /100 | #129 | Exceptional 96.1% |
| Soviet Union | 92.6 /100 | #130 | Exceptional 96.1% |
| Pueblo | 92.3 /100 | #131 | Exceptional 96.1% |
| Immigrants | Kuwait | 92.2 /100 | #132 | Exceptional 96.1% |
| Immigrants | Turkey | 91.7 /100 | #133 | Exceptional 96.1% |
| Immigrants | Hungary | 91.5 /100 | #134 | Exceptional 96.1% |
| Basques | 91.5 /100 | #135 | Exceptional 96.1% |
| Jordanians | 91.3 /100 | #136 | Exceptional 96.1% |
| Cambodians | 90.6 /100 | #137 | Exceptional 96.1% |
| Burmese | 90.2 /100 | #138 | Exceptional 96.1% |