Immigrants from South Central Asia vs Immigrants from Croatia Householder Income Ages 25 - 44 years
COMPARE
Immigrants from South Central Asia
Immigrants from Croatia
Householder Income Ages 25 - 44 years
Householder Income Ages 25 - 44 years Comparison
Immigrants from South Central Asia
Immigrants from Croatia
$116,626
HOUSEHOLDER INCOME AGES 25 - 44 YEARS
100.0/ 100
METRIC RATING
15th/ 347
METRIC RANK
$104,503
HOUSEHOLDER INCOME AGES 25 - 44 YEARS
99.6/ 100
METRIC RATING
70th/ 347
METRIC RANK
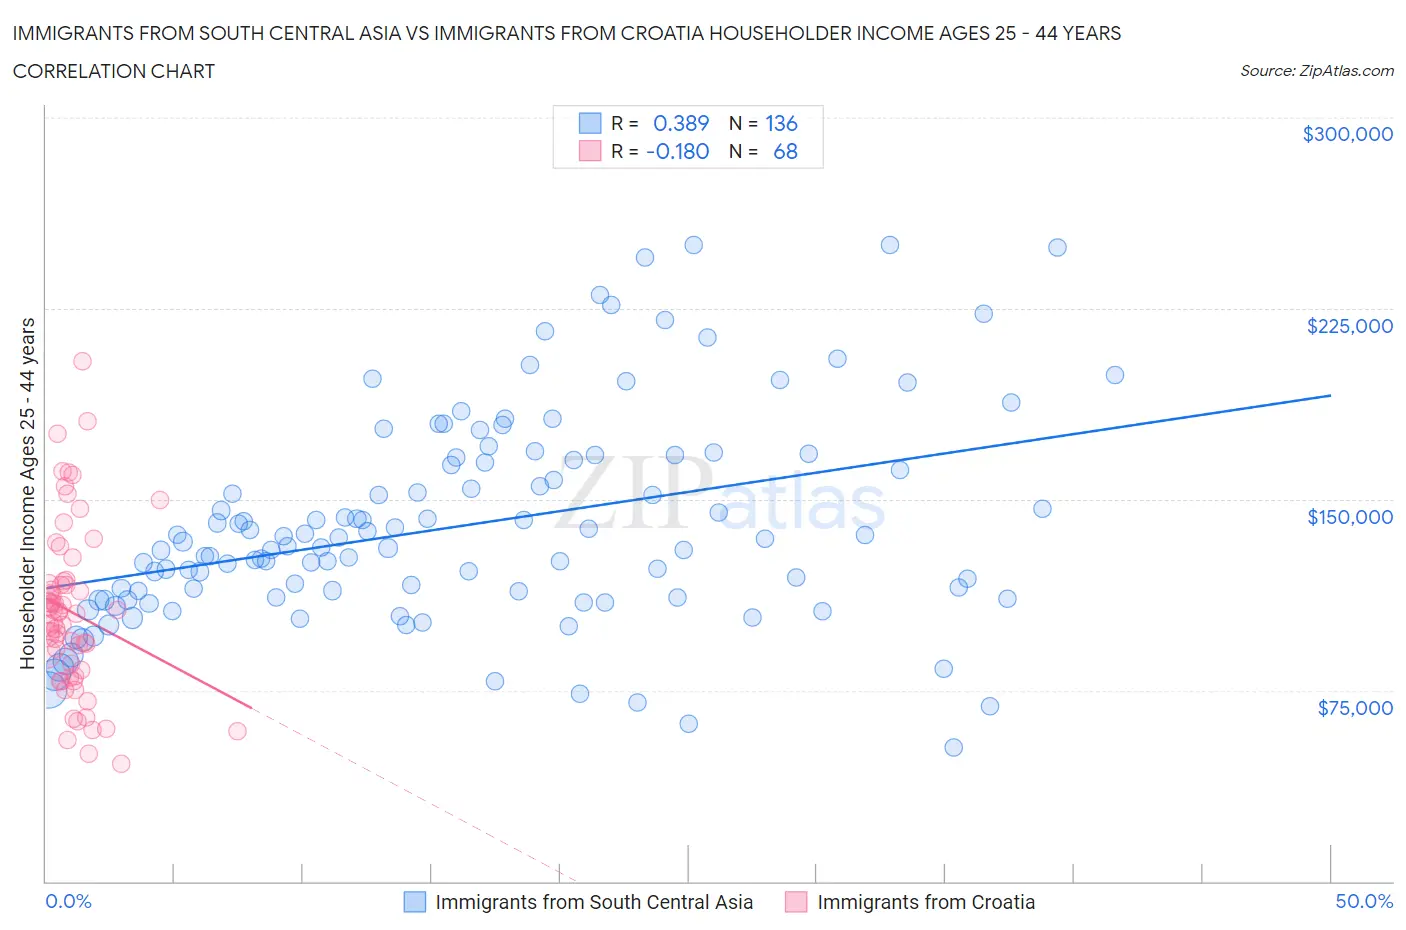
Immigrants from South Central Asia vs Immigrants from Croatia Householder Income Ages 25 - 44 years Correlation Chart
The statistical analysis conducted on geographies consisting of 471,423,947 people shows a mild positive correlation between the proportion of Immigrants from South Central Asia and household income with householder between the ages 25 and 44 in the United States with a correlation coefficient (R) of 0.389 and weighted average of $116,626. Similarly, the statistical analysis conducted on geographies consisting of 132,471,786 people shows a poor negative correlation between the proportion of Immigrants from Croatia and household income with householder between the ages 25 and 44 in the United States with a correlation coefficient (R) of -0.180 and weighted average of $104,503, a difference of 11.6%.
Householder Income Ages 25 - 44 years Correlation Summary
| Measurement | Immigrants from South Central Asia | Immigrants from Croatia |
| Minimum | $52,604 | $46,094 |
| Maximum | $250,001 | $204,358 |
| Range | $197,397 | $158,264 |
| Mean | $139,407 | $105,655 |
| Median | $131,527 | $105,430 |
| Interquartile 25% (IQ1) | $111,176 | $81,770 |
| Interquartile 75% (IQ3) | $164,920 | $117,378 |
| Interquartile Range (IQR) | $53,743 | $35,608 |
| Standard Deviation (Sample) | $41,092 | $32,858 |
| Standard Deviation (Population) | $40,940 | $32,615 |
Similar Demographics by Householder Income Ages 25 - 44 years
Demographics Similar to Immigrants from South Central Asia by Householder Income Ages 25 - 44 years
In terms of householder income ages 25 - 44 years, the demographic groups most similar to Immigrants from South Central Asia are Cypriot ($116,364, a difference of 0.23%), Immigrants from Israel ($117,219, a difference of 0.51%), Immigrants from Australia ($115,947, a difference of 0.59%), Immigrants from Eastern Asia ($118,056, a difference of 1.2%), and Eastern European ($114,523, a difference of 1.8%).
| Demographics | Rating | Rank | Householder Income Ages 25 - 44 years |
| Iranians | 100.0 /100 | #8 | Exceptional $120,292 |
| Immigrants | China | 100.0 /100 | #9 | Exceptional $119,756 |
| Indians (Asian) | 100.0 /100 | #10 | Exceptional $119,496 |
| Okinawans | 100.0 /100 | #11 | Exceptional $119,349 |
| Immigrants | Iran | 100.0 /100 | #12 | Exceptional $119,204 |
| Immigrants | Eastern Asia | 100.0 /100 | #13 | Exceptional $118,056 |
| Immigrants | Israel | 100.0 /100 | #14 | Exceptional $117,219 |
| Immigrants | South Central Asia | 100.0 /100 | #15 | Exceptional $116,626 |
| Cypriots | 100.0 /100 | #16 | Exceptional $116,364 |
| Immigrants | Australia | 100.0 /100 | #17 | Exceptional $115,947 |
| Eastern Europeans | 100.0 /100 | #18 | Exceptional $114,523 |
| Burmese | 100.0 /100 | #19 | Exceptional $113,701 |
| Immigrants | Korea | 100.0 /100 | #20 | Exceptional $113,401 |
| Asians | 100.0 /100 | #21 | Exceptional $112,666 |
| Immigrants | Belgium | 100.0 /100 | #22 | Exceptional $112,575 |
Demographics Similar to Immigrants from Croatia by Householder Income Ages 25 - 44 years
In terms of householder income ages 25 - 44 years, the demographic groups most similar to Immigrants from Croatia are Mongolian ($104,578, a difference of 0.070%), Afghan ($104,410, a difference of 0.090%), Immigrants from Eastern Europe ($104,662, a difference of 0.15%), Immigrants from Romania ($104,713, a difference of 0.20%), and Chinese ($104,264, a difference of 0.23%).
| Demographics | Rating | Rank | Householder Income Ages 25 - 44 years |
| Immigrants | Scotland | 99.7 /100 | #63 | Exceptional $105,089 |
| New Zealanders | 99.7 /100 | #64 | Exceptional $105,085 |
| Immigrants | Netherlands | 99.7 /100 | #65 | Exceptional $105,082 |
| Laotians | 99.7 /100 | #66 | Exceptional $104,993 |
| Immigrants | Romania | 99.6 /100 | #67 | Exceptional $104,713 |
| Immigrants | Eastern Europe | 99.6 /100 | #68 | Exceptional $104,662 |
| Mongolians | 99.6 /100 | #69 | Exceptional $104,578 |
| Immigrants | Croatia | 99.6 /100 | #70 | Exceptional $104,503 |
| Afghans | 99.6 /100 | #71 | Exceptional $104,410 |
| Chinese | 99.5 /100 | #72 | Exceptional $104,264 |
| Italians | 99.5 /100 | #73 | Exceptional $104,215 |
| Immigrants | Fiji | 99.5 /100 | #74 | Exceptional $103,954 |
| Koreans | 99.4 /100 | #75 | Exceptional $103,824 |
| Immigrants | Spain | 99.4 /100 | #76 | Exceptional $103,752 |
| Immigrants | Southern Europe | 99.3 /100 | #77 | Exceptional $103,486 |