Immigrants from South Central Asia vs Immigrants from Barbados Householder Income Ages 25 - 44 years
COMPARE
Immigrants from South Central Asia
Immigrants from Barbados
Householder Income Ages 25 - 44 years
Householder Income Ages 25 - 44 years Comparison
Immigrants from South Central Asia
Immigrants from Barbados
$116,626
HOUSEHOLDER INCOME AGES 25 - 44 YEARS
100.0/ 100
METRIC RATING
15th/ 347
METRIC RANK
$88,687
HOUSEHOLDER INCOME AGES 25 - 44 YEARS
3.7/ 100
METRIC RATING
229th/ 347
METRIC RANK
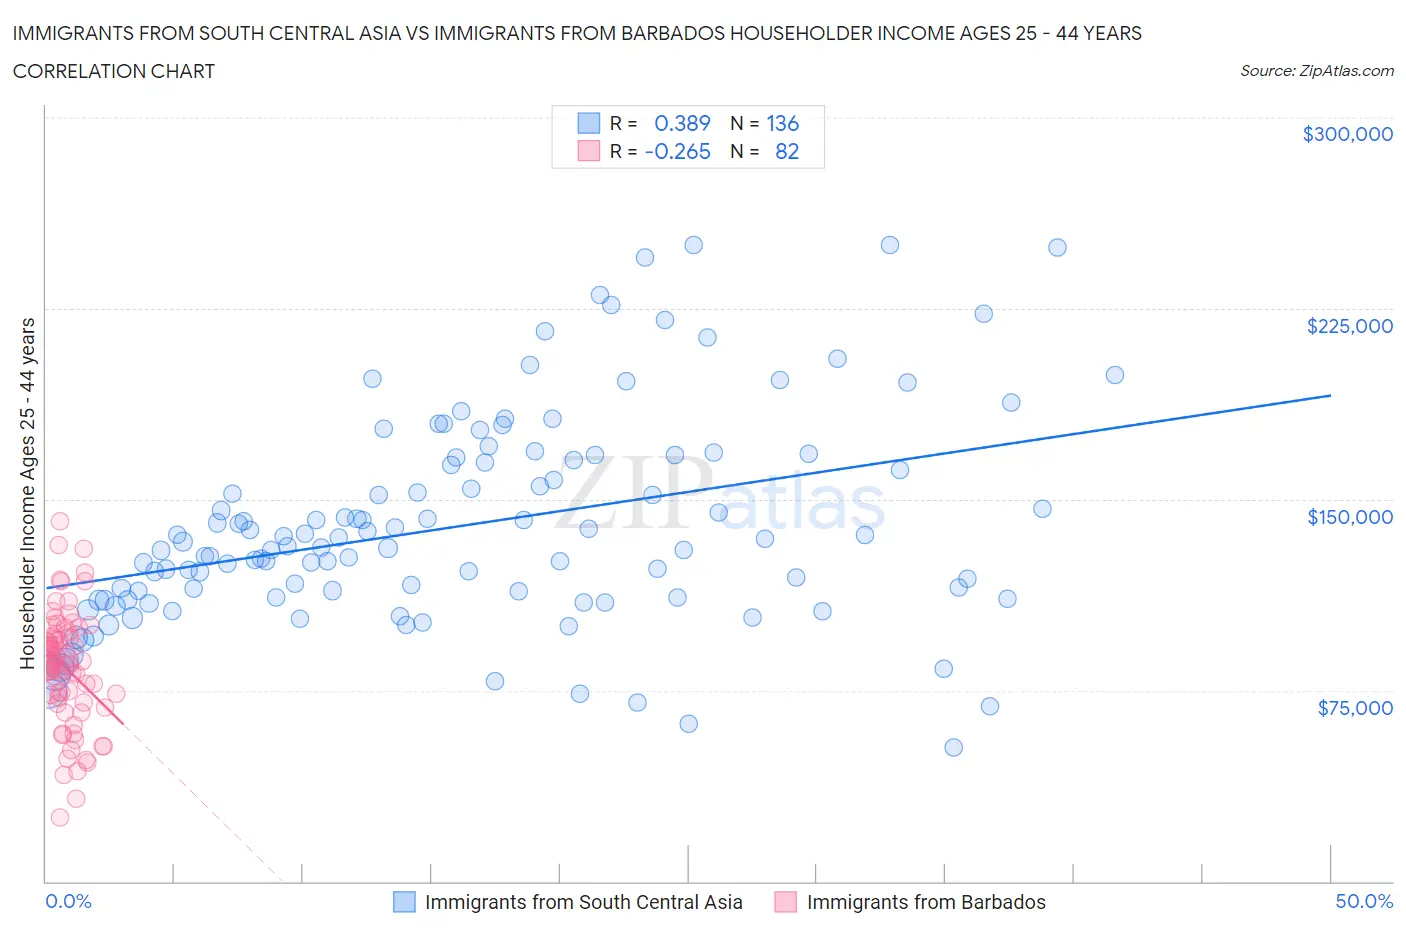
Immigrants from South Central Asia vs Immigrants from Barbados Householder Income Ages 25 - 44 years Correlation Chart
The statistical analysis conducted on geographies consisting of 471,423,947 people shows a mild positive correlation between the proportion of Immigrants from South Central Asia and household income with householder between the ages 25 and 44 in the United States with a correlation coefficient (R) of 0.389 and weighted average of $116,626. Similarly, the statistical analysis conducted on geographies consisting of 112,714,156 people shows a weak negative correlation between the proportion of Immigrants from Barbados and household income with householder between the ages 25 and 44 in the United States with a correlation coefficient (R) of -0.265 and weighted average of $88,687, a difference of 31.5%.
Householder Income Ages 25 - 44 years Correlation Summary
| Measurement | Immigrants from South Central Asia | Immigrants from Barbados |
| Minimum | $52,604 | $24,836 |
| Maximum | $250,001 | $141,528 |
| Range | $197,397 | $116,692 |
| Mean | $139,407 | $83,858 |
| Median | $131,527 | $85,381 |
| Interquartile 25% (IQ1) | $111,176 | $72,198 |
| Interquartile 75% (IQ3) | $164,920 | $95,727 |
| Interquartile Range (IQR) | $53,743 | $23,529 |
| Standard Deviation (Sample) | $41,092 | $22,403 |
| Standard Deviation (Population) | $40,940 | $22,266 |
Similar Demographics by Householder Income Ages 25 - 44 years
Demographics Similar to Immigrants from South Central Asia by Householder Income Ages 25 - 44 years
In terms of householder income ages 25 - 44 years, the demographic groups most similar to Immigrants from South Central Asia are Cypriot ($116,364, a difference of 0.23%), Immigrants from Israel ($117,219, a difference of 0.51%), Immigrants from Australia ($115,947, a difference of 0.59%), Immigrants from Eastern Asia ($118,056, a difference of 1.2%), and Eastern European ($114,523, a difference of 1.8%).
| Demographics | Rating | Rank | Householder Income Ages 25 - 44 years |
| Iranians | 100.0 /100 | #8 | Exceptional $120,292 |
| Immigrants | China | 100.0 /100 | #9 | Exceptional $119,756 |
| Indians (Asian) | 100.0 /100 | #10 | Exceptional $119,496 |
| Okinawans | 100.0 /100 | #11 | Exceptional $119,349 |
| Immigrants | Iran | 100.0 /100 | #12 | Exceptional $119,204 |
| Immigrants | Eastern Asia | 100.0 /100 | #13 | Exceptional $118,056 |
| Immigrants | Israel | 100.0 /100 | #14 | Exceptional $117,219 |
| Immigrants | South Central Asia | 100.0 /100 | #15 | Exceptional $116,626 |
| Cypriots | 100.0 /100 | #16 | Exceptional $116,364 |
| Immigrants | Australia | 100.0 /100 | #17 | Exceptional $115,947 |
| Eastern Europeans | 100.0 /100 | #18 | Exceptional $114,523 |
| Burmese | 100.0 /100 | #19 | Exceptional $113,701 |
| Immigrants | Korea | 100.0 /100 | #20 | Exceptional $113,401 |
| Asians | 100.0 /100 | #21 | Exceptional $112,666 |
| Immigrants | Belgium | 100.0 /100 | #22 | Exceptional $112,575 |
Demographics Similar to Immigrants from Barbados by Householder Income Ages 25 - 44 years
In terms of householder income ages 25 - 44 years, the demographic groups most similar to Immigrants from Barbados are Immigrants from Bosnia and Herzegovina ($88,819, a difference of 0.15%), Immigrants from St. Vincent and the Grenadines ($88,888, a difference of 0.23%), Alaskan Athabascan ($88,446, a difference of 0.27%), Immigrants from Grenada ($88,311, a difference of 0.43%), and Nonimmigrants ($88,301, a difference of 0.44%).
| Demographics | Rating | Rank | Householder Income Ages 25 - 44 years |
| Immigrants | Ecuador | 6.2 /100 | #222 | Tragic $89,673 |
| Immigrants | Guyana | 5.9 /100 | #223 | Tragic $89,586 |
| Barbadians | 5.9 /100 | #224 | Tragic $89,565 |
| Immigrants | Panama | 5.5 /100 | #225 | Tragic $89,451 |
| Immigrants | Iraq | 5.5 /100 | #226 | Tragic $89,444 |
| Immigrants | St. Vincent and the Grenadines | 4.1 /100 | #227 | Tragic $88,888 |
| Immigrants | Bosnia and Herzegovina | 4.0 /100 | #228 | Tragic $88,819 |
| Immigrants | Barbados | 3.7 /100 | #229 | Tragic $88,687 |
| Alaskan Athabascans | 3.3 /100 | #230 | Tragic $88,446 |
| Immigrants | Grenada | 3.0 /100 | #231 | Tragic $88,311 |
| Immigrants | Nonimmigrants | 3.0 /100 | #232 | Tragic $88,301 |
| Malaysians | 3.0 /100 | #233 | Tragic $88,291 |
| Venezuelans | 2.9 /100 | #234 | Tragic $88,232 |
| Bermudans | 2.9 /100 | #235 | Tragic $88,231 |
| Immigrants | Cameroon | 2.9 /100 | #236 | Tragic $88,214 |