Immigrants from South America vs South American Indian No Schooling Completed
COMPARE
Immigrants from South America
South American Indian
No Schooling Completed
No Schooling Completed Comparison
Immigrants from South America
South American Indians
2.5%
NO SCHOOLING COMPLETED
0.6/ 100
METRIC RATING
257th/ 347
METRIC RANK
2.2%
NO SCHOOLING COMPLETED
11.0/ 100
METRIC RATING
207th/ 347
METRIC RANK
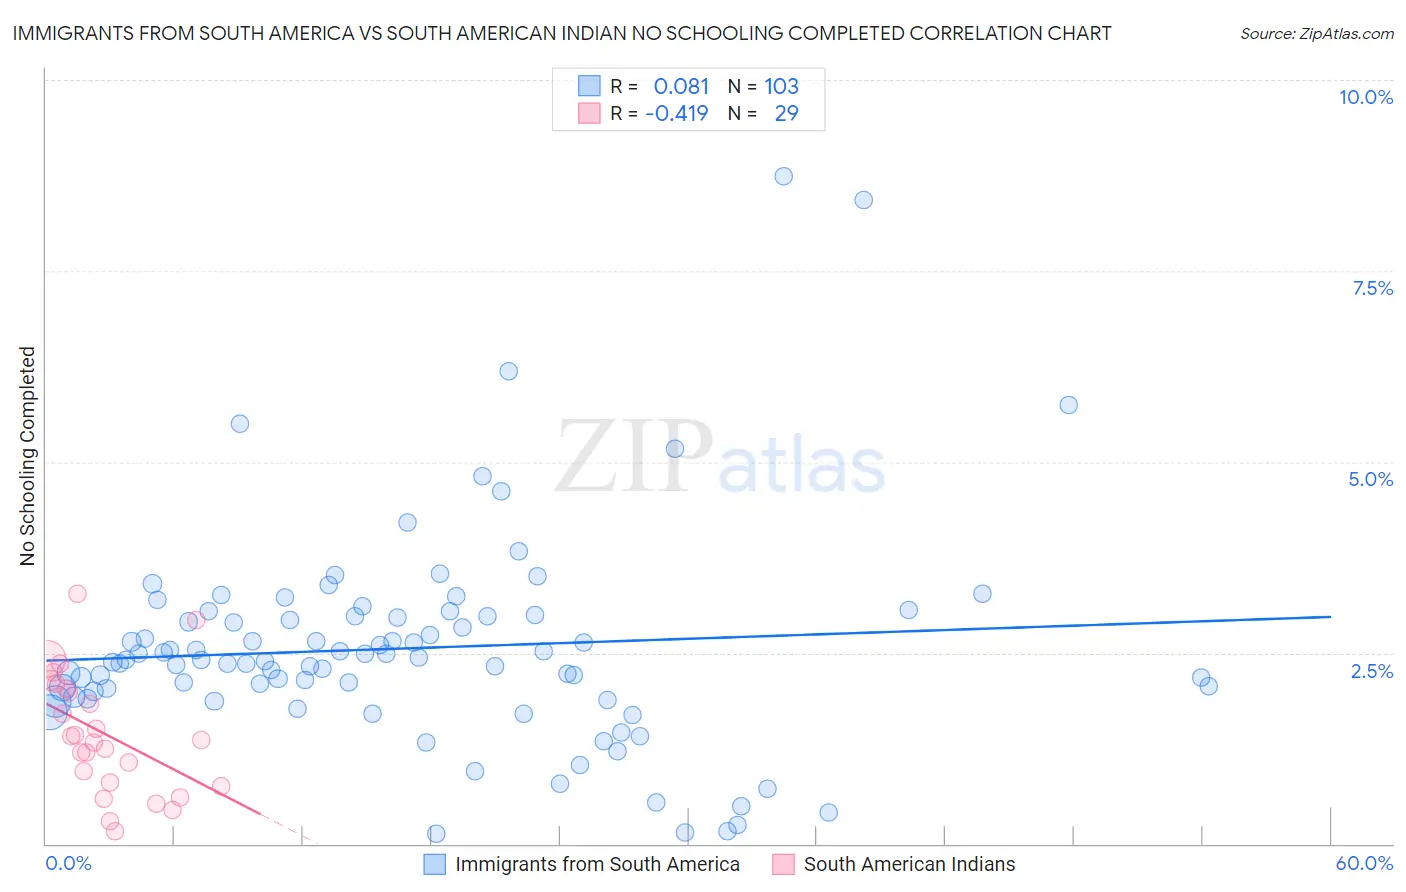
Immigrants from South America vs South American Indian No Schooling Completed Correlation Chart
The statistical analysis conducted on geographies consisting of 479,047,016 people shows a slight positive correlation between the proportion of Immigrants from South America and percentage of population with no schooling in the United States with a correlation coefficient (R) of 0.081 and weighted average of 2.5%. Similarly, the statistical analysis conducted on geographies consisting of 164,141,114 people shows a moderate negative correlation between the proportion of South American Indians and percentage of population with no schooling in the United States with a correlation coefficient (R) of -0.419 and weighted average of 2.2%, a difference of 9.6%.
No Schooling Completed Correlation Summary
| Measurement | Immigrants from South America | South American Indian |
| Minimum | 0.14% | 0.17% |
| Maximum | 8.7% | 3.3% |
| Range | 8.6% | 3.1% |
| Mean | 2.6% | 1.4% |
| Median | 2.4% | 1.4% |
| Interquartile 25% (IQ1) | 1.9% | 0.77% |
| Interquartile 75% (IQ3) | 3.0% | 2.1% |
| Interquartile Range (IQR) | 1.1% | 1.3% |
| Standard Deviation (Sample) | 1.4% | 0.79% |
| Standard Deviation (Population) | 1.4% | 0.78% |
Similar Demographics by No Schooling Completed
Demographics Similar to Immigrants from South America by No Schooling Completed
In terms of no schooling completed, the demographic groups most similar to Immigrants from South America are Assyrian/Chaldean/Syriac (2.5%, a difference of 0.030%), Immigrants from Jamaica (2.5%, a difference of 0.090%), Immigrants from Ethiopia (2.5%, a difference of 0.14%), Armenian (2.5%, a difference of 0.26%), and Immigrants from Sierra Leone (2.5%, a difference of 0.61%).
| Demographics | Rating | Rank | No Schooling Completed |
| Immigrants | Middle Africa | 1.1 /100 | #250 | Tragic 2.4% |
| Immigrants | Africa | 1.1 /100 | #251 | Tragic 2.4% |
| Immigrants | Colombia | 1.0 /100 | #252 | Tragic 2.4% |
| Immigrants | Asia | 0.9 /100 | #253 | Tragic 2.4% |
| Immigrants | Eastern Africa | 0.9 /100 | #254 | Tragic 2.4% |
| Ethiopians | 0.8 /100 | #255 | Tragic 2.4% |
| Yaqui | 0.8 /100 | #256 | Tragic 2.4% |
| Immigrants | South America | 0.6 /100 | #257 | Tragic 2.5% |
| Assyrians/Chaldeans/Syriacs | 0.6 /100 | #258 | Tragic 2.5% |
| Immigrants | Jamaica | 0.6 /100 | #259 | Tragic 2.5% |
| Immigrants | Ethiopia | 0.6 /100 | #260 | Tragic 2.5% |
| Armenians | 0.5 /100 | #261 | Tragic 2.5% |
| Immigrants | Sierra Leone | 0.5 /100 | #262 | Tragic 2.5% |
| Immigrants | Liberia | 0.4 /100 | #263 | Tragic 2.5% |
| Indians (Asian) | 0.4 /100 | #264 | Tragic 2.5% |
Demographics Similar to South American Indians by No Schooling Completed
In terms of no schooling completed, the demographic groups most similar to South American Indians are Uruguayan (2.2%, a difference of 0.0%), Bahamian (2.2%, a difference of 0.18%), Immigrants from Bahamas (2.2%, a difference of 0.19%), Immigrants from Oceania (2.2%, a difference of 0.26%), and Native/Alaskan (2.2%, a difference of 0.33%).
| Demographics | Rating | Rank | No Schooling Completed |
| Immigrants | Northern Africa | 19.5 /100 | #200 | Poor 2.2% |
| Costa Ricans | 17.1 /100 | #201 | Poor 2.2% |
| Moroccans | 13.7 /100 | #202 | Poor 2.2% |
| Laotians | 13.3 /100 | #203 | Poor 2.2% |
| Hopi | 12.9 /100 | #204 | Poor 2.2% |
| Immigrants | Bahamas | 11.6 /100 | #205 | Poor 2.2% |
| Bahamians | 11.6 /100 | #206 | Poor 2.2% |
| South American Indians | 11.0 /100 | #207 | Poor 2.2% |
| Uruguayans | 11.0 /100 | #208 | Poor 2.2% |
| Immigrants | Oceania | 10.2 /100 | #209 | Poor 2.2% |
| Natives/Alaskans | 10.0 /100 | #210 | Tragic 2.2% |
| Immigrants | Panama | 8.8 /100 | #211 | Tragic 2.3% |
| Immigrants | Morocco | 8.7 /100 | #212 | Tragic 2.3% |
| Ute | 8.2 /100 | #213 | Tragic 2.3% |
| Samoans | 8.2 /100 | #214 | Tragic 2.3% |