Immigrants from South America vs Immigrants from Indonesia Householder Income Ages 25 - 44 years
COMPARE
Immigrants from South America
Immigrants from Indonesia
Householder Income Ages 25 - 44 years
Householder Income Ages 25 - 44 years Comparison
Immigrants from South America
Immigrants from Indonesia
$94,042
HOUSEHOLDER INCOME AGES 25 - 44 YEARS
42.8/ 100
METRIC RATING
178th/ 347
METRIC RANK
$107,627
HOUSEHOLDER INCOME AGES 25 - 44 YEARS
99.9/ 100
METRIC RATING
44th/ 347
METRIC RANK
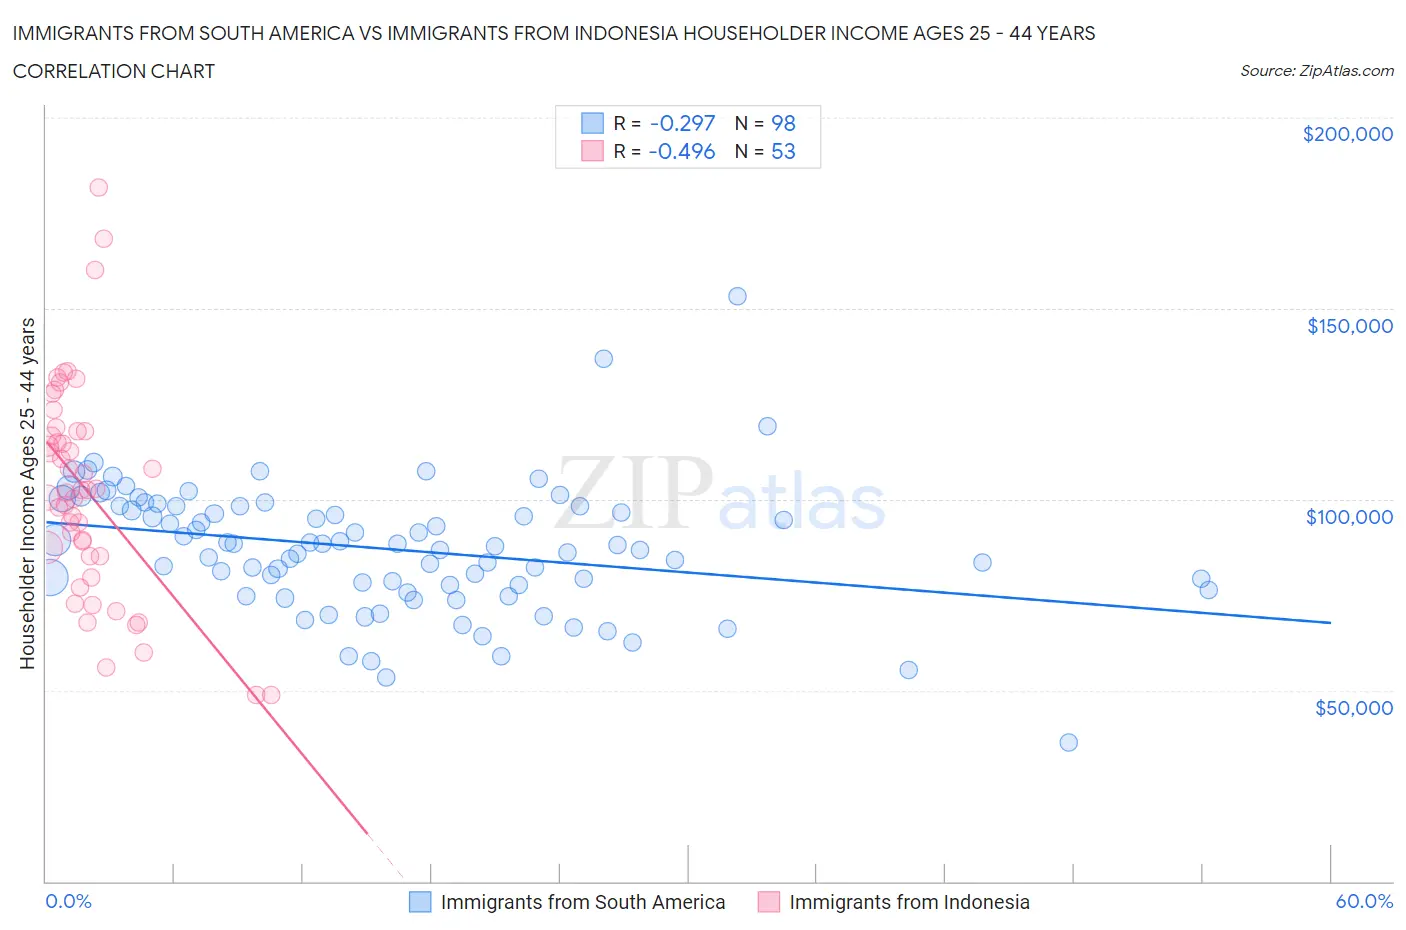
Immigrants from South America vs Immigrants from Indonesia Householder Income Ages 25 - 44 years Correlation Chart
The statistical analysis conducted on geographies consisting of 484,511,014 people shows a weak negative correlation between the proportion of Immigrants from South America and household income with householder between the ages 25 and 44 in the United States with a correlation coefficient (R) of -0.297 and weighted average of $94,042. Similarly, the statistical analysis conducted on geographies consisting of 215,479,216 people shows a moderate negative correlation between the proportion of Immigrants from Indonesia and household income with householder between the ages 25 and 44 in the United States with a correlation coefficient (R) of -0.496 and weighted average of $107,627, a difference of 14.4%.
Householder Income Ages 25 - 44 years Correlation Summary
| Measurement | Immigrants from South America | Immigrants from Indonesia |
| Minimum | $36,176 | $48,644 |
| Maximum | $153,313 | $181,667 |
| Range | $117,137 | $133,023 |
| Mean | $86,995 | $102,424 |
| Median | $87,907 | $102,321 |
| Interquartile 25% (IQ1) | $77,429 | $85,037 |
| Interquartile 75% (IQ3) | $98,212 | $117,969 |
| Interquartile Range (IQR) | $20,783 | $32,932 |
| Standard Deviation (Sample) | $16,981 | $28,015 |
| Standard Deviation (Population) | $16,895 | $27,749 |
Similar Demographics by Householder Income Ages 25 - 44 years
Demographics Similar to Immigrants from South America by Householder Income Ages 25 - 44 years
In terms of householder income ages 25 - 44 years, the demographic groups most similar to Immigrants from South America are Belgian ($94,262, a difference of 0.23%), French Canadian ($93,694, a difference of 0.37%), Immigrants ($94,423, a difference of 0.40%), French ($93,665, a difference of 0.40%), and English ($94,429, a difference of 0.41%).
| Demographics | Rating | Rank | Householder Income Ages 25 - 44 years |
| Immigrants | Armenia | 54.2 /100 | #171 | Average $94,867 |
| Scottish | 50.8 /100 | #172 | Average $94,622 |
| Finns | 50.6 /100 | #173 | Average $94,610 |
| Colombians | 50.0 /100 | #174 | Average $94,565 |
| English | 48.1 /100 | #175 | Average $94,429 |
| Immigrants | Immigrants | 48.0 /100 | #176 | Average $94,423 |
| Belgians | 45.8 /100 | #177 | Average $94,262 |
| Immigrants | South America | 42.8 /100 | #178 | Average $94,042 |
| French Canadians | 38.2 /100 | #179 | Fair $93,694 |
| French | 37.8 /100 | #180 | Fair $93,665 |
| Puget Sound Salish | 37.7 /100 | #181 | Fair $93,661 |
| Uruguayans | 37.3 /100 | #182 | Fair $93,631 |
| Guamanians/Chamorros | 36.5 /100 | #183 | Fair $93,569 |
| Germans | 36.0 /100 | #184 | Fair $93,531 |
| Immigrants | Eritrea | 35.2 /100 | #185 | Fair $93,466 |
Demographics Similar to Immigrants from Indonesia by Householder Income Ages 25 - 44 years
In terms of householder income ages 25 - 44 years, the demographic groups most similar to Immigrants from Indonesia are Immigrants from Malaysia ($107,650, a difference of 0.020%), Israeli ($107,579, a difference of 0.040%), Immigrants from Belarus ($107,393, a difference of 0.22%), Australian ($107,912, a difference of 0.26%), and Estonian ($107,269, a difference of 0.33%).
| Demographics | Rating | Rank | Householder Income Ages 25 - 44 years |
| Immigrants | Russia | 100.0 /100 | #37 | Exceptional $108,751 |
| Soviet Union | 100.0 /100 | #38 | Exceptional $108,457 |
| Immigrants | France | 99.9 /100 | #39 | Exceptional $108,257 |
| Immigrants | Lithuania | 99.9 /100 | #40 | Exceptional $108,149 |
| Immigrants | Bolivia | 99.9 /100 | #41 | Exceptional $108,128 |
| Australians | 99.9 /100 | #42 | Exceptional $107,912 |
| Immigrants | Malaysia | 99.9 /100 | #43 | Exceptional $107,650 |
| Immigrants | Indonesia | 99.9 /100 | #44 | Exceptional $107,627 |
| Israelis | 99.9 /100 | #45 | Exceptional $107,579 |
| Immigrants | Belarus | 99.9 /100 | #46 | Exceptional $107,393 |
| Estonians | 99.9 /100 | #47 | Exceptional $107,269 |
| Bulgarians | 99.9 /100 | #48 | Exceptional $107,264 |
| Immigrants | Turkey | 99.9 /100 | #49 | Exceptional $107,258 |
| Cambodians | 99.9 /100 | #50 | Exceptional $107,148 |
| Immigrants | Czechoslovakia | 99.9 /100 | #51 | Exceptional $106,888 |