Somali vs Comanche Householder Income Over 65 years
COMPARE
Somali
Comanche
Householder Income Over 65 years
Householder Income Over 65 years Comparison
Somalis
Comanche
$54,004
HOUSEHOLDER INCOME OVER 65 YEARS
0.1/ 100
METRIC RATING
281st/ 347
METRIC RANK
$54,922
HOUSEHOLDER INCOME OVER 65 YEARS
0.2/ 100
METRIC RATING
261st/ 347
METRIC RANK
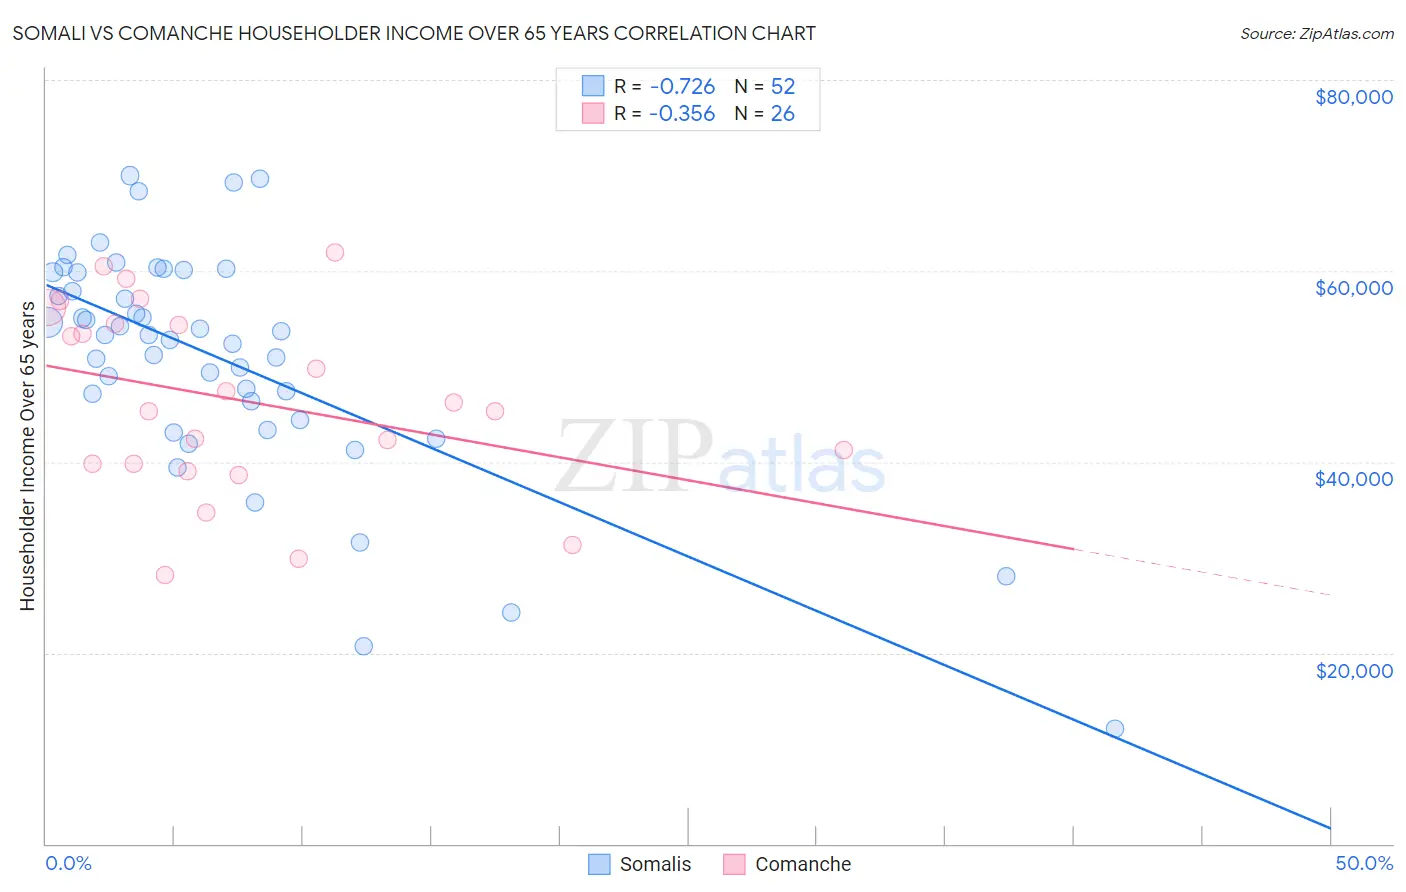
Somali vs Comanche Householder Income Over 65 years Correlation Chart
The statistical analysis conducted on geographies consisting of 99,125,363 people shows a strong negative correlation between the proportion of Somalis and household income with householder over the age of 65 in the United States with a correlation coefficient (R) of -0.726 and weighted average of $54,004. Similarly, the statistical analysis conducted on geographies consisting of 109,617,596 people shows a mild negative correlation between the proportion of Comanche and household income with householder over the age of 65 in the United States with a correlation coefficient (R) of -0.356 and weighted average of $54,922, a difference of 1.7%.
Householder Income Over 65 years Correlation Summary
| Measurement | Somali | Comanche |
| Minimum | $12,049 | $28,127 |
| Maximum | $69,985 | $61,875 |
| Range | $57,936 | $33,748 |
| Mean | $50,826 | $46,472 |
| Median | $53,340 | $45,782 |
| Interquartile 25% (IQ1) | $45,352 | $39,810 |
| Interquartile 75% (IQ3) | $59,867 | $54,432 |
| Interquartile Range (IQR) | $14,515 | $14,621 |
| Standard Deviation (Sample) | $12,083 | $9,777 |
| Standard Deviation (Population) | $11,967 | $9,587 |
Demographics Similar to Somalis and Comanche by Householder Income Over 65 years
In terms of householder income over 65 years, the demographic groups most similar to Somalis are Immigrants from Jamaica ($54,027, a difference of 0.040%), Immigrants from Ecuador ($54,030, a difference of 0.050%), Blackfeet ($54,029, a difference of 0.050%), Cheyenne ($54,096, a difference of 0.17%), and Cree ($54,129, a difference of 0.23%). Similarly, the demographic groups most similar to Comanche are Bangladeshi ($54,719, a difference of 0.37%), French American Indian ($54,699, a difference of 0.41%), Apache ($54,668, a difference of 0.46%), Belizean ($54,580, a difference of 0.63%), and Jamaican ($54,560, a difference of 0.66%).
| Demographics | Rating | Rank | Householder Income Over 65 years |
| Comanche | 0.2 /100 | #261 | Tragic $54,922 |
| Bangladeshis | 0.1 /100 | #262 | Tragic $54,719 |
| French American Indians | 0.1 /100 | #263 | Tragic $54,699 |
| Apache | 0.1 /100 | #264 | Tragic $54,668 |
| Belizeans | 0.1 /100 | #265 | Tragic $54,580 |
| Jamaicans | 0.1 /100 | #266 | Tragic $54,560 |
| Guatemalans | 0.1 /100 | #267 | Tragic $54,526 |
| Immigrants | Zaire | 0.1 /100 | #268 | Tragic $54,512 |
| Nicaraguans | 0.1 /100 | #269 | Tragic $54,474 |
| Immigrants | Senegal | 0.1 /100 | #270 | Tragic $54,447 |
| Liberians | 0.1 /100 | #271 | Tragic $54,356 |
| Potawatomi | 0.1 /100 | #272 | Tragic $54,212 |
| Indonesians | 0.1 /100 | #273 | Tragic $54,176 |
| Barbadians | 0.1 /100 | #274 | Tragic $54,163 |
| Cherokee | 0.1 /100 | #275 | Tragic $54,133 |
| Cree | 0.1 /100 | #276 | Tragic $54,129 |
| Cheyenne | 0.1 /100 | #277 | Tragic $54,096 |
| Immigrants | Ecuador | 0.1 /100 | #278 | Tragic $54,030 |
| Blackfeet | 0.1 /100 | #279 | Tragic $54,029 |
| Immigrants | Jamaica | 0.1 /100 | #280 | Tragic $54,027 |
| Somalis | 0.1 /100 | #281 | Tragic $54,004 |