Immigrants from Somalia vs Moroccan Median Male Earnings
COMPARE
Immigrants from Somalia
Moroccan
Median Male Earnings
Median Male Earnings Comparison
Immigrants from Somalia
Moroccans
$48,439
MEDIAN MALE EARNINGS
0.3/ 100
METRIC RATING
275th/ 347
METRIC RANK
$56,499
MEDIAN MALE EARNINGS
87.7/ 100
METRIC RATING
134th/ 347
METRIC RANK
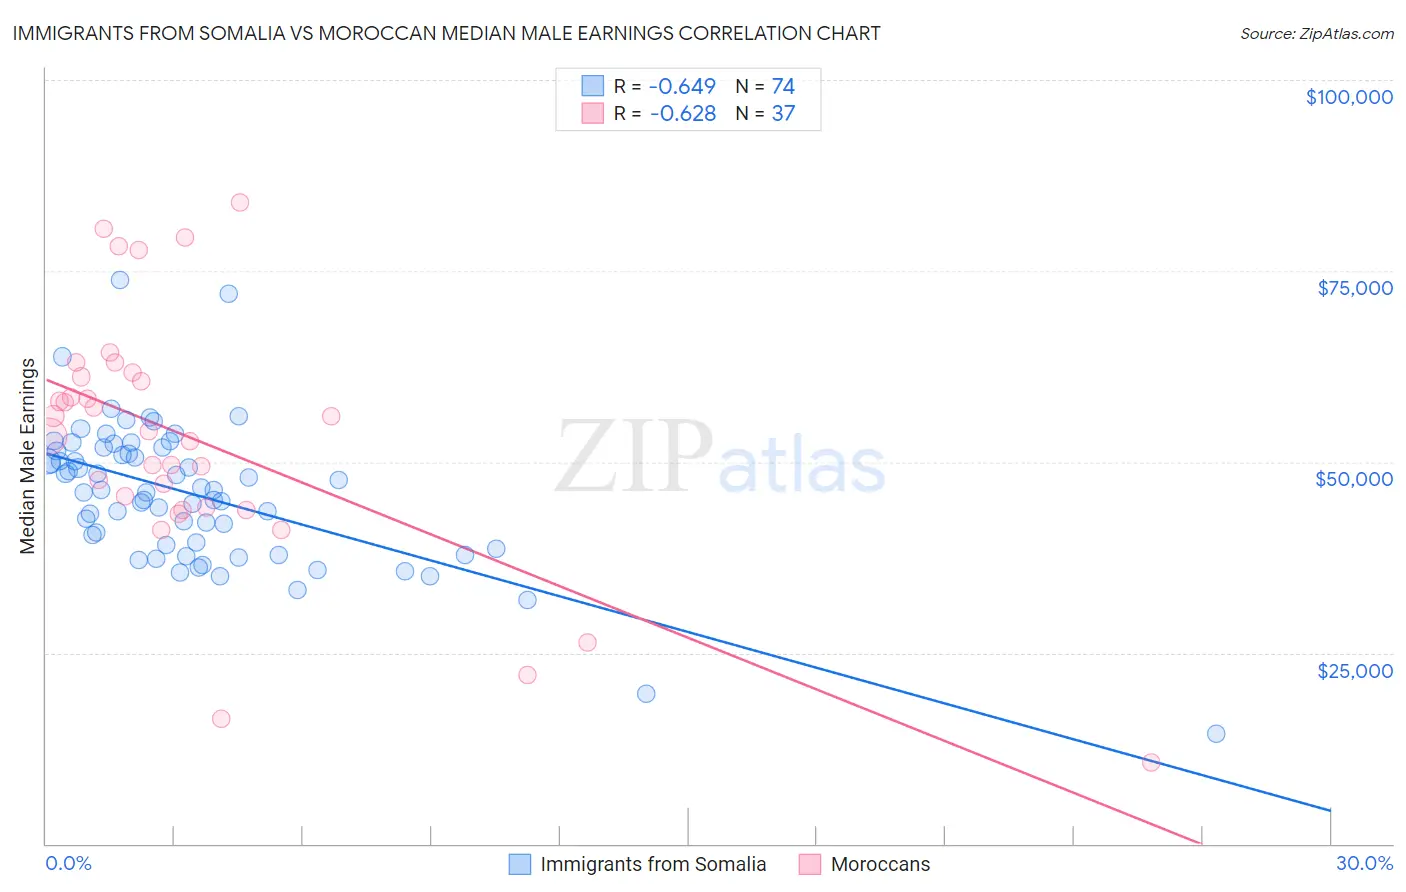
Immigrants from Somalia vs Moroccan Median Male Earnings Correlation Chart
The statistical analysis conducted on geographies consisting of 92,109,982 people shows a significant negative correlation between the proportion of Immigrants from Somalia and median male earnings in the United States with a correlation coefficient (R) of -0.649 and weighted average of $48,439. Similarly, the statistical analysis conducted on geographies consisting of 201,785,575 people shows a significant negative correlation between the proportion of Moroccans and median male earnings in the United States with a correlation coefficient (R) of -0.628 and weighted average of $56,499, a difference of 16.6%.
Median Male Earnings Correlation Summary
| Measurement | Immigrants from Somalia | Moroccan |
| Minimum | $14,382 | $10,662 |
| Maximum | $73,796 | $84,023 |
| Range | $59,414 | $73,361 |
| Mean | $45,683 | $52,885 |
| Median | $46,151 | $54,008 |
| Interquartile 25% (IQ1) | $39,154 | $43,924 |
| Interquartile 75% (IQ3) | $51,463 | $61,434 |
| Interquartile Range (IQR) | $12,309 | $17,511 |
| Standard Deviation (Sample) | $9,409 | $16,590 |
| Standard Deviation (Population) | $9,346 | $16,364 |
Similar Demographics by Median Male Earnings
Demographics Similar to Immigrants from Somalia by Median Male Earnings
In terms of median male earnings, the demographic groups most similar to Immigrants from Somalia are Blackfeet ($48,402, a difference of 0.080%), Colville ($48,516, a difference of 0.16%), Belizean ($48,358, a difference of 0.17%), Immigrants from Liberia ($48,317, a difference of 0.25%), and Hmong ($48,254, a difference of 0.38%).
| Demographics | Rating | Rank | Median Male Earnings |
| Ute | 0.4 /100 | #268 | Tragic $48,899 |
| Tsimshian | 0.4 /100 | #269 | Tragic $48,836 |
| Potawatomi | 0.4 /100 | #270 | Tragic $48,768 |
| Cherokee | 0.3 /100 | #271 | Tragic $48,669 |
| Salvadorans | 0.3 /100 | #272 | Tragic $48,646 |
| Jamaicans | 0.3 /100 | #273 | Tragic $48,632 |
| Colville | 0.3 /100 | #274 | Tragic $48,516 |
| Immigrants | Somalia | 0.3 /100 | #275 | Tragic $48,439 |
| Blackfeet | 0.3 /100 | #276 | Tragic $48,402 |
| Belizeans | 0.2 /100 | #277 | Tragic $48,358 |
| Immigrants | Liberia | 0.2 /100 | #278 | Tragic $48,317 |
| Hmong | 0.2 /100 | #279 | Tragic $48,254 |
| Comanche | 0.2 /100 | #280 | Tragic $48,202 |
| Marshallese | 0.2 /100 | #281 | Tragic $48,137 |
| Central Americans | 0.2 /100 | #282 | Tragic $48,093 |
Demographics Similar to Moroccans by Median Male Earnings
In terms of median male earnings, the demographic groups most similar to Moroccans are Irish ($56,464, a difference of 0.060%), Czech ($56,546, a difference of 0.080%), Immigrants from Germany ($56,542, a difference of 0.080%), Immigrants from Saudi Arabia ($56,452, a difference of 0.080%), and Slavic ($56,390, a difference of 0.19%).
| Demographics | Rating | Rank | Median Male Earnings |
| Brazilians | 90.9 /100 | #127 | Exceptional $56,837 |
| Immigrants | Syria | 90.8 /100 | #128 | Exceptional $56,830 |
| Pakistanis | 89.9 /100 | #129 | Excellent $56,719 |
| Koreans | 89.4 /100 | #130 | Excellent $56,672 |
| Portuguese | 89.4 /100 | #131 | Excellent $56,663 |
| Czechs | 88.2 /100 | #132 | Excellent $56,546 |
| Immigrants | Germany | 88.2 /100 | #133 | Excellent $56,542 |
| Moroccans | 87.7 /100 | #134 | Excellent $56,499 |
| Irish | 87.4 /100 | #135 | Excellent $56,464 |
| Immigrants | Saudi Arabia | 87.2 /100 | #136 | Excellent $56,452 |
| Slavs | 86.5 /100 | #137 | Excellent $56,390 |
| Slovaks | 85.5 /100 | #138 | Excellent $56,306 |
| Zimbabweans | 85.5 /100 | #139 | Excellent $56,302 |
| Luxembourgers | 85.5 /100 | #140 | Excellent $56,300 |
| Danes | 84.8 /100 | #141 | Excellent $56,246 |