Chinese vs Immigrants from Senegal Householder Income Over 65 years
COMPARE
Chinese
Immigrants from Senegal
Householder Income Over 65 years
Householder Income Over 65 years Comparison
Chinese
Immigrants from Senegal
$77,465
HOUSEHOLDER INCOME OVER 65 YEARS
100.0/ 100
METRIC RATING
1st/ 347
METRIC RANK
$54,447
HOUSEHOLDER INCOME OVER 65 YEARS
0.1/ 100
METRIC RATING
270th/ 347
METRIC RANK
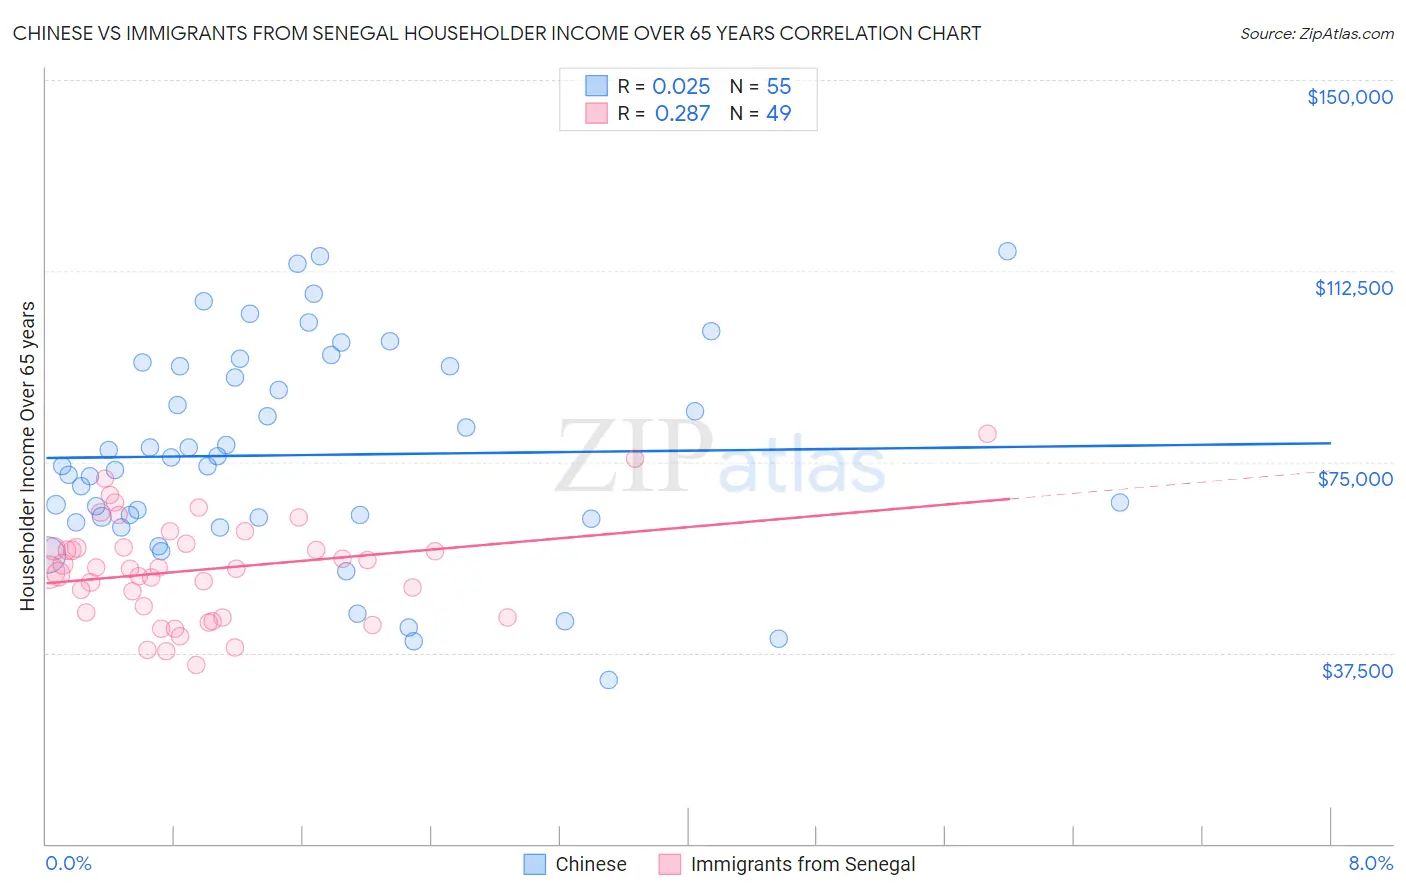
Chinese vs Immigrants from Senegal Householder Income Over 65 years Correlation Chart
The statistical analysis conducted on geographies consisting of 64,728,631 people shows no correlation between the proportion of Chinese and household income with householder over the age of 65 in the United States with a correlation coefficient (R) of 0.025 and weighted average of $77,465. Similarly, the statistical analysis conducted on geographies consisting of 90,018,715 people shows a weak positive correlation between the proportion of Immigrants from Senegal and household income with householder over the age of 65 in the United States with a correlation coefficient (R) of 0.287 and weighted average of $54,447, a difference of 42.3%.
Householder Income Over 65 years Correlation Summary
| Measurement | Chinese | Immigrants from Senegal |
| Minimum | $32,143 | $35,208 |
| Maximum | $116,276 | $80,537 |
| Range | $84,133 | $45,329 |
| Mean | $76,332 | $53,928 |
| Median | $74,246 | $54,081 |
| Interquartile 25% (IQ1) | $63,846 | $44,902 |
| Interquartile 75% (IQ3) | $93,750 | $58,588 |
| Interquartile Range (IQR) | $29,904 | $13,686 |
| Standard Deviation (Sample) | $20,626 | $10,096 |
| Standard Deviation (Population) | $20,438 | $9,992 |
Similar Demographics by Householder Income Over 65 years
Demographics Similar to Chinese by Householder Income Over 65 years
In terms of householder income over 65 years, the demographic groups most similar to Chinese are Iranian ($77,429, a difference of 0.050%), Immigrants from Taiwan ($77,051, a difference of 0.54%), Filipino ($76,686, a difference of 1.0%), Immigrants from Iran ($75,081, a difference of 3.2%), and Bolivian ($74,245, a difference of 4.3%).
| Demographics | Rating | Rank | Householder Income Over 65 years |
| Chinese | 100.0 /100 | #1 | Exceptional $77,465 |
| Iranians | 100.0 /100 | #2 | Exceptional $77,429 |
| Immigrants | Taiwan | 100.0 /100 | #3 | Exceptional $77,051 |
| Filipinos | 100.0 /100 | #4 | Exceptional $76,686 |
| Immigrants | Iran | 100.0 /100 | #5 | Exceptional $75,081 |
| Bolivians | 100.0 /100 | #6 | Exceptional $74,245 |
| Immigrants | Bolivia | 100.0 /100 | #7 | Exceptional $73,434 |
| Immigrants | Singapore | 100.0 /100 | #8 | Exceptional $72,963 |
| Immigrants | India | 100.0 /100 | #9 | Exceptional $72,804 |
| Bhutanese | 100.0 /100 | #10 | Exceptional $72,288 |
| Thais | 100.0 /100 | #11 | Exceptional $72,099 |
| Cypriots | 100.0 /100 | #12 | Exceptional $71,714 |
| Immigrants | Hong Kong | 100.0 /100 | #13 | Exceptional $71,567 |
| Burmese | 100.0 /100 | #14 | Exceptional $71,139 |
| Native Hawaiians | 100.0 /100 | #15 | Exceptional $71,021 |
Demographics Similar to Immigrants from Senegal by Householder Income Over 65 years
In terms of householder income over 65 years, the demographic groups most similar to Immigrants from Senegal are Nicaraguan ($54,474, a difference of 0.050%), Immigrants from Zaire ($54,512, a difference of 0.12%), Guatemalan ($54,526, a difference of 0.15%), Liberian ($54,356, a difference of 0.17%), and Jamaican ($54,560, a difference of 0.21%).
| Demographics | Rating | Rank | Householder Income Over 65 years |
| French American Indians | 0.1 /100 | #263 | Tragic $54,699 |
| Apache | 0.1 /100 | #264 | Tragic $54,668 |
| Belizeans | 0.1 /100 | #265 | Tragic $54,580 |
| Jamaicans | 0.1 /100 | #266 | Tragic $54,560 |
| Guatemalans | 0.1 /100 | #267 | Tragic $54,526 |
| Immigrants | Zaire | 0.1 /100 | #268 | Tragic $54,512 |
| Nicaraguans | 0.1 /100 | #269 | Tragic $54,474 |
| Immigrants | Senegal | 0.1 /100 | #270 | Tragic $54,447 |
| Liberians | 0.1 /100 | #271 | Tragic $54,356 |
| Potawatomi | 0.1 /100 | #272 | Tragic $54,212 |
| Indonesians | 0.1 /100 | #273 | Tragic $54,176 |
| Barbadians | 0.1 /100 | #274 | Tragic $54,163 |
| Cherokee | 0.1 /100 | #275 | Tragic $54,133 |
| Cree | 0.1 /100 | #276 | Tragic $54,129 |
| Cheyenne | 0.1 /100 | #277 | Tragic $54,096 |