Immigrants from Scotland vs Immigrants from Yemen Disability Age 18 to 34
COMPARE
Immigrants from Scotland
Immigrants from Yemen
Disability Age 18 to 34
Disability Age 18 to 34 Comparison
Immigrants from Scotland
Immigrants from Yemen
6.8%
DISABILITY AGE 18 TO 34
12.4/ 100
METRIC RATING
208th/ 347
METRIC RANK
7.0%
DISABILITY AGE 18 TO 34
4.2/ 100
METRIC RATING
228th/ 347
METRIC RANK
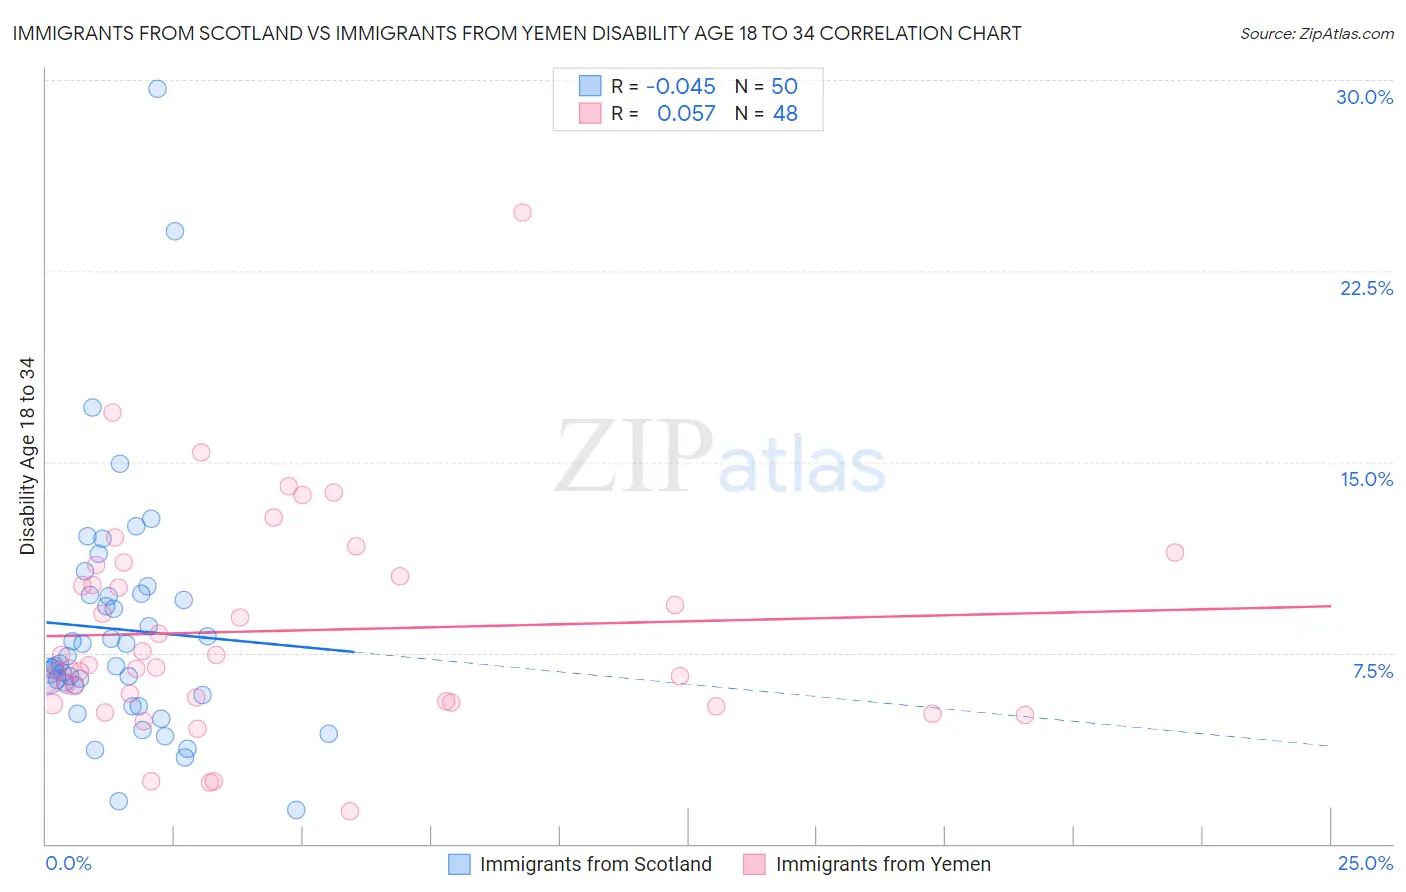
Immigrants from Scotland vs Immigrants from Yemen Disability Age 18 to 34 Correlation Chart
The statistical analysis conducted on geographies consisting of 196,150,775 people shows no correlation between the proportion of Immigrants from Scotland and percentage of population with a disability between the ages 18 and 35 in the United States with a correlation coefficient (R) of -0.045 and weighted average of 6.8%. Similarly, the statistical analysis conducted on geographies consisting of 82,428,971 people shows a slight positive correlation between the proportion of Immigrants from Yemen and percentage of population with a disability between the ages 18 and 35 in the United States with a correlation coefficient (R) of 0.057 and weighted average of 7.0%, a difference of 2.0%.
Disability Age 18 to 34 Correlation Summary
| Measurement | Immigrants from Scotland | Immigrants from Yemen |
| Minimum | 1.3% | 1.3% |
| Maximum | 29.7% | 24.8% |
| Range | 28.3% | 23.5% |
| Mean | 8.4% | 8.4% |
| Median | 7.0% | 7.0% |
| Interquartile 25% (IQ1) | 5.9% | 5.6% |
| Interquartile 75% (IQ3) | 9.8% | 10.7% |
| Interquartile Range (IQR) | 3.9% | 5.2% |
| Standard Deviation (Sample) | 5.0% | 4.3% |
| Standard Deviation (Population) | 4.9% | 4.2% |
Demographics Similar to Immigrants from Scotland and Immigrants from Yemen by Disability Age 18 to 34
In terms of disability age 18 to 34, the demographic groups most similar to Immigrants from Scotland are Immigrants from Burma/Myanmar (6.8%, a difference of 0.020%), Latvian (6.8%, a difference of 0.22%), Immigrants from Norway (6.8%, a difference of 0.42%), Luxembourger (6.9%, a difference of 0.52%), and Immigrants from Western Europe (6.9%, a difference of 0.59%). Similarly, the demographic groups most similar to Immigrants from Yemen are Immigrants from Canada (7.0%, a difference of 0.050%), Ugandan (6.9%, a difference of 0.10%), Central American Indian (6.9%, a difference of 0.21%), Senegalese (6.9%, a difference of 0.29%), and Carpatho Rusyn (6.9%, a difference of 0.38%).
| Demographics | Rating | Rank | Disability Age 18 to 34 |
| Immigrants | Scotland | 12.4 /100 | #208 | Poor 6.8% |
| Immigrants | Burma/Myanmar | 12.3 /100 | #209 | Poor 6.8% |
| Latvians | 11.1 /100 | #210 | Poor 6.8% |
| Immigrants | Norway | 10.0 /100 | #211 | Tragic 6.8% |
| Luxembourgers | 9.4 /100 | #212 | Tragic 6.9% |
| Immigrants | Western Europe | 9.1 /100 | #213 | Tragic 6.9% |
| Serbians | 8.2 /100 | #214 | Tragic 6.9% |
| Immigrants | Thailand | 7.5 /100 | #215 | Tragic 6.9% |
| Sudanese | 7.0 /100 | #216 | Tragic 6.9% |
| Immigrants | Kenya | 6.9 /100 | #217 | Tragic 6.9% |
| Ukrainians | 6.7 /100 | #218 | Tragic 6.9% |
| Hawaiians | 6.5 /100 | #219 | Tragic 6.9% |
| Immigrants | Senegal | 5.5 /100 | #220 | Tragic 6.9% |
| Immigrants | Middle Africa | 5.5 /100 | #221 | Tragic 6.9% |
| Immigrants | England | 5.3 /100 | #222 | Tragic 6.9% |
| Carpatho Rusyns | 5.2 /100 | #223 | Tragic 6.9% |
| Senegalese | 4.9 /100 | #224 | Tragic 6.9% |
| Central American Indians | 4.7 /100 | #225 | Tragic 6.9% |
| Ugandans | 4.4 /100 | #226 | Tragic 6.9% |
| Immigrants | Canada | 4.3 /100 | #227 | Tragic 7.0% |
| Immigrants | Yemen | 4.2 /100 | #228 | Tragic 7.0% |